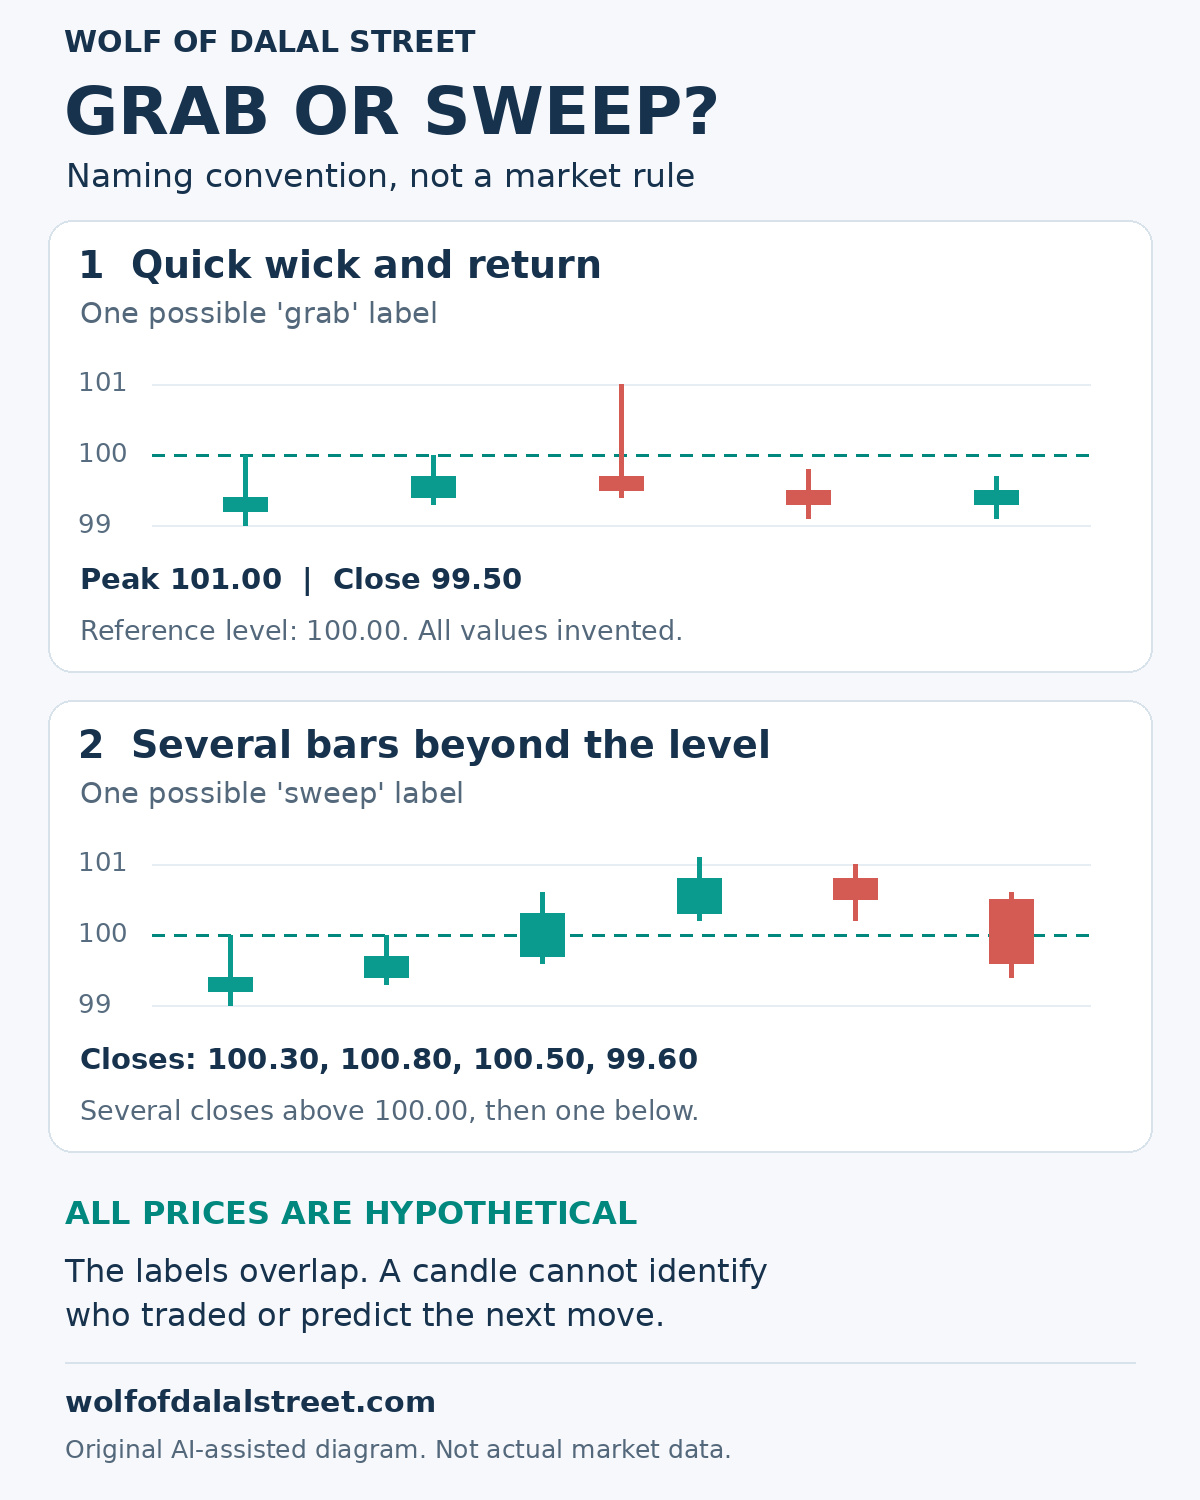
Original AI-assisted educational diagram. All candles and prices are invented, not a chart of any real security or a trading signal.
Educational explanation only. I am not a SEBI registered analyst. This is not a trade recommendation. No stock tips, price targets or return promises.
A liquidity grab and a liquidity sweep are not two universally fixed chart categories. Traders often use the words for similar moves beyond an earlier high or low. Some educational material calls a quick wick-and-return a grab and a broader, multi-candle excursion a sweep. That is a naming convention, not an exchange rule or a reliable forecast.
The useful question is not which label sounds more professional. It is what price actually did, which interval the chart represents, and what the available evidence cannot establish.
In market microstructure, liquidity concerns the ability to transact, the available prices and quantities, and the cost of execution. CME Group’s liquidity-tool guide, for example, measures bid-ask spread, order-book depth and cost to trade. These are more specific than drawing a line above a candle.
In Smart Money Concepts and related retail charting material, a liquidity pool often means an area where the author expects orders to be concentrated. Common reference points include earlier highs, earlier lows and range boundaries. Traders may expect buy-stop interest above a high or sell-stop interest below a low.
An expected order cluster is not an observed order cluster. A price chart does not disclose every stop order, its size, its owner or the reason it was placed. A company having cash on its balance sheet is also a different use of the word liquidity; this article is about market trading, not corporate cash reserves.
The disagreement is visible in the source material itself. Radex Markets describes a grab as a faster, often single-candle event and a sweep as a broader move that can take several candles. PFH Markets emphasises a targeted move versus a broader clearing of levels. LiquidityScan instead distinguishes the visible sweep pattern from an inferred grabbing action, while acknowledging that the words are frequently swapped.
Those explanations are not identical. For this article, we use the following limited convention so that the examples are readable. Another educator may label the same chart differently.
Price briefly trades beyond a marked high or low and returns to the original side, often leaving a visible wick within one candle on the chosen timeframe. A wick is the line showing the candle’s high or low beyond its opening-and-closing body.
Price moves through an area or several nearby levels over a wider sequence. It may spend several candles beyond the reference, sometimes consolidating there, before returning. Some authors also call a single wick-and-return a sweep. There is no universal minimum number of candles, distance or elapsed time.
Neither word, by itself, establishes that an institution caused the move, that stops were actually clustered there, or that a reversal must follow.
Hypothetical example, not a real stock: an earlier reference high is Rs 100.00. A five-minute candle opens at Rs 99.70, reaches Rs 101.00, trades as low as Rs 99.40 and closes at Rs 99.50.
Under the quick-rejection convention, an educator might call this a grab. Another might call it a sweep-and-reclaim. Both can be describing the same four observed prices.
Now add a separate assumption: suppose someone had submitted a buy stop with a trigger of Rs 100.20. Under the last-traded-price trigger logic described by NSE, a move to or above that trigger can activate the order even though this candle eventually closes below Rs 100.00. Activation and the final candle close are different events. This example does not establish that such an order really existed, what type it was, whether it filled or at what price.
Another invented sequence uses the same Rs 100.00 reference. Four consecutive five-minute candles close at:
In this constructed example, three closes remain above the reference before the fourth returns below it. Under the broader-excursion convention, an educator might call the sequence a sweep rather than a one-candle grab.
Notice what the description does not contain: the number of stops triggered, the identity of a large trader or a guaranteed direction after the fourth candle. Several closes near a level can describe consolidation; they do not prove that a particular participant was accumulating or distributing a position.
Take an invented reference low of Rs 200.00. A candle trades down to Rs 199.20 and later closes at Rs 200.30. The excursion below the reference is Rs 0.80; the close is Rs 0.30 above it.
Some traders would describe this as a sell-side liquidity grab or sweep. Sell-stop interest below an earlier low is their proposed explanation. The observation is simply that price traded below the line and returned above it. That observation does not prove the amount or existence of hidden stop interest, and it is not a buy instruction.
Suppose the invented closes after a break above Rs 100.00 are Rs 100.30, Rs 100.80 and Rs 101.60. At that point in the sequence, no close has returned below the reference.
It would be misleading to describe a completed wick-and-reclaim reversal that has not happened. The move may continue, stall or return later. The label cannot settle that question. A screenshot selected only after the eventual outcome can make a vague pattern look more precise than it was in real time.
A single five-minute candle contains trading activity that can be displayed as five one-minute candles. The five-minute bar in Example 1 could contain several one-minute closes above Rs 100.00 before its final return. On one chart it looks like a single wick; on another it looks like a sequence.
That is why a meaningful description identifies the instrument, venue or data feed, reference level, candle interval and observation window. A statement such as price returned below the earlier high by the five-minute close is more precise than smart money grabbed liquidity.
NSE’s published equity trading-system explanation describes stop-loss orders being held until their trigger is reached or crossed, then released into the regular order book. It says a buy stop is triggered when the normal market’s last traded price reaches or exceeds its trigger, and a sell stop when it reaches or falls below its trigger. Its matching explanation concerns prices, orders and available counterparties, not a grab-versus-sweep classification.
Do not turn that into the claim that every stop everywhere becomes the same kind of order. Available order types and trigger rules depend on the venue, segment and broker. FINRA’s US-stock investor guidance separately explains that an ordinary stop order becomes a market order and can execute away from its stop price. It also explains that a stop-limit order has an execution-price constraint but may not execute at all. That US guidance is not a substitute for an Indian venue’s rules.
The general distinction is important: a trigger condition, an order becoming active, an execution and a candle closing are not interchangeable events. A candle chart alone is not an audit trail of those events.
No. Large orders and triggered orders can affect prices, particularly when available depth is limited. That possibility does not identify who traded in a particular candle or prove deliberate targeting.
A price move can also reflect changing quotes, news, thin depth, a gap or multiple participants reacting together. The four prices in a candle do not identify a bank, fund or motive. Even a volume spike measures activity in the data being shown, not intent. Calling a move a stop hunt is a trader’s interpretation, not proof of misconduct.
This is also why phrases such as institutions always reverse after taking liquidity or a sweep guarantees the next trend should be treated as unsupported claims. The sources reviewed do not establish a universal win rate or guaranteed outcome for either label.
This is a reading checklist, not an entry, exit or stop-placement strategy. It does not make a trading decision for the reader.
A quick wick-and-return versus a broader multi-candle excursion can be a useful teaching convention. It is not a universal dividing line between liquidity grab and liquidity sweep. Describe the price behaviour first, state the convention being used and keep participant intent separate from what the chart actually shows.
AI disclosure: This original educational explanation and hypothetical diagram were generated with AI assistance and source-checked on 22 November 2026. All worked prices are invented. No trade was placed or recommended. I am not a SEBI registered analyst.
Read news in English and Hindi with the free Wolf News app.
Wolf of Dalal Street: https://wolfofdalalstreet.com
Stockmarket360: https://stockmarket360.in
BizTechIndia: https://biztechindia.com
Jobat360: https://jobat360.com
Trending on Net: https://trendingonnet.com
Blog + daily digest: https://wolfofdalalstreetofficial.blogspot.com and https://wolfofindia.blogspot.com
Free news app: https://wolfnews.surge.sh (turn on notifications)
Wolf of Dalal Street: https://www.youtube.com/@WOLFOFINDIA360
CHANNELS (free updates by message, our newsletter)
WhatsApp channel: https://whatsapp.com/channel/0029VaswZ107YSdBnLu1FY3g
Telegram (Wolf of India): https://t.me/WOLFOFINDIA
Telegram (Wolf of Dalal Street): https://t.me/wolfofdalalstreetofficial
Telegram (Stockmarket360): https://t.me/stockmarket360official
Telegram (BizTechIndia): https://t.me/biztechindia
Telegram (Trending Online): https://t.me/Trendingonlineofficial
WhatsApp Business (join, message preferred): https://wa.me/919619991645
LinkedIn: https://www.linkedin.com/company/wolfofdalalstreet/
Instagram: https://www.instagram.com/wolfofindiaofficial
Facebook: https://facebook.com/wolfofdalalstreetofficial
X: https://x.com/Wolf_India360
Reddit community: https://www.reddit.com/r/WOLFOFDALALSTREETJOIN/
Quora Space: https://wolfofdalalstreet.quora.com
Diigo: https://www.diigo.com/user/wolfdalalstreet
https://wolfofdalalstreet.com/feed/ | https://stockmarket360.in/feed/ | https://biztechindia.com/feed/ | https://jobat360.com/feed/ | https://trendingonnet.com/feed/ | https://wolfofdalalstreetofficial.blogspot.com/feeds/posts/default
Market and business education only. Not investment advice. No tips, no targets.
REC confirms the 21 November Vikramshila SPV transfer to Adani Energy Solutions. Why consideration, project…
One fund, more than one number An ETF screen may show a traded price while…
Two instruments, two different jobs A rights issue can create an unfamiliar entry in a…
Start with what the index measures A green index can sit beside a red portfolio…
तारीख वाले भाव, लाइव नहीं। आर्काइव फोटो2022: प्रधानमंत्री कार्यालय / विकिमीडिया कॉमन्स, GODL-India। फोटो स्रोत:…
Dated comparison, not live. Portrait: Prime Minister's Office / Wikimedia Commons, GODL-India, archive2022. Photo source:…