On 14th Oct 2020, the Nifty P/E ratio or PE ratio has hit a historical high of 34.87. This was an all-time high since 1st January 1999. This means the Nifty 50 was valued at 34.87 times its earnings. The latest PE ratio at the time of publication is 32.27 (4 November 2020). All the Traders and Investors are concerned if this high PE is a major indicator of a new stock market crash.
If you want to reach the peak of “all-time high” you really need some great qualifications. Once upon a time during the Harshad Mehta Scam, Sensex PE hit an all-time high (55-60) which in today’s date still not been even touched. Analyze Market Timing with Index PE Ratio. One of the best performing and respected intelligent investors which had told from their past experiences, “during the 2008 crash, the Sensex PE was high but it much lower than what it was in the early 1990s. Therefore we were so optimistic and bullish on markets and could not even think of the stock market mayhem”.
This Company is India’s Largest Wireless Carrier backed by Reliance’s Mukesh Ambani, Eyeing to get Listed on Nasdaq; Overseas IPO likely by 2021
Historical PE values of no consequence with respect to determining the future course of the market.
Any equities markets have a tendency to crash any time there is a collective lack of faith in future prospects, at a “low PE” or a “high PE”.
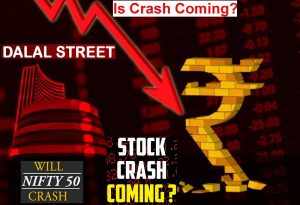
Will the market crash because Nifty PE is at an all-time high?
If you want to predict accurate Stock Market timings with the PE ratio it really gives you good results but it does not function in the way we want! It is the most effective tool to minimize your risk and also to make you aware sometimes of falling into a bull or bear traps. Whether these real-time strategies will give you more results and also more returns is pretty much crazy luck.
This Indian Private Sector Bank is now the Most Expensive Banking Stock in the World
In my overview, a high PE does not really mean much. If you wish to use the Nifty PE for market timing, you could use as a tool to minimize risk and not to maximize your returns. Every Newbie investors on Dalal Street are always dreaming if they buy on dips, they will get more returns. Sorry, it does not work that way and might put you at more risk and losses if you try to catch a falling knife.
Nobody in the Universe knows which side is the market heading in the future, however, I am aware of one important aspect: If you are waiting for the market to fall is the worst mistake an investor can do. Believe it or not, if you choose to time the market, systematic investment is essential. Those who deploy a tactical strategy slowly and steadily implement and execute it.
The benchmark index Nifty in the last month of October 2020 achieved a new milestone. Its PE ratio conquered an all-time high of 34.9x. It means that investors are now ready to shell out Rs 34.9 for every 1 Re earnings earned by the index. How crazy and expensive is that?
If you see in real terms, it’s around 70% higher than the long-term average PE of around 20 times. It’s like buying a stock valued at Rs 100 on average, at Rs 170.
Mahindra Group, Chairman, Anand Mahindra Invests $1 Million in Indian Social Network Start-up Hapramp
Does this make the Nifty and Sensex not just overvalued but significantly overvalued in my perception and then shouldn’t you be worried about a stock market crash?
Is it the Right Time to Sell My Stocks?
As Sensex and Nifty reaching is heading higher and an all-time high PE doesn’t mean it that the rally is over and it could not go higher and touch new higher PEs. Here’s some for perspective…
The BSE Sensex, another benchmark index and one with a longer history than the Nifty, had once peaked at a PE of close to 50x during the Harshad Mehta Times.
Yes, that’s means 50 times its earnings. So you cannot rule out the possibility that it may not go higher to touch the new All-Time High in coming times and There’s still no valid reason why the Nifty can’t reach those levels before coming crashing down. Hence, if you clear and exit all your stocks now from the portfolio and the index keeps going higher, you will regret on missing out the gains.
But on another side, you also had to think to safeguard your portfolio against a second down leg of the stock market crash and the possibility of which is higher now than was back in March 2020.
It’s Mind-Boggling Decisions, isn’t it? To sell or not to sell the Stocks.
In my career, I had seen a lot of investors who are not all worried or scared about a stock market crash and are still 100% invested all the time.
Over a period of time they had developed a perception that since the company shares in the long-term are all about higher highs and higher lows, it doesn’t make any sense to get out of it and also not Book Profits.
Gautam Adani backed Adani Green Energy Wins World’s Largest Solar Contract; To Invest 45,000 Crores to Build Mega Solar Project
On the contrary, I had seen a couple of investors who will take quick and smart decisions to sell all their stocks and reduce their portfolio holdings and will return back to the market only after a deep dive market correction of around 30 percent or more.
I always stick to one point, and I truly follow the following lines from Ben Graham’s classic The Intelligent Investor.
It is the mark of an educated mind to expect that amount of exactness which the nature of the particular subject admits.
Put differently, precision has no place in the field of investing.
In investing, it is always better to be approximately right than precisely wrong.
Attempting to be exact would mean being persuaded about a severe stock market correction or a major bull run and situating your portfolio as needs are.
Notwithstanding, if the market went in precisely the other way to your exact forecast, you could experience a huge setback.
Indian Power Giant Tata Power to Build Massive Charging Infrastructure; to Create 700 Electric Vehicle Charging Stations By FY21
This is the reason I generally attempt to be approximately right.
For Illustration If I have Rs 1000 in my wallet, And I put Rs 250 each in Shares, bonds/fixed deposits. I will then take a call on the remaining Rs 500 based on the stock market’s current conditions.
If the markets are reasonably attractive like they were in April 2020, I will put the remaining Rs 500 in stocks and thus have a stock: bond exposure ratio of 75:25.
If the markets are extremely overvalued like they are in this current scenario, I can shift the exposure ratio to 50:50 or also even 25:75 in favor of fixed deposits/bonds.
At present, since the Nifty PE is at an all-time high, I will always advise you for an exposure ratio of 75:25.
If we go in the past and see The US elections in November 2016 had a tremendous opportunity for a huge impact on global fund flows. But we already knew the kind of stocks that could make the most of such money supply.
Very soon Sensex 40,000 became touched a new milestone in June 2019. The United States had gone to the polls once again. And like in 2016, the poll results can have a huge impact and massive outcomes on India’s fund inflows, trade policies, foreign policies, and of course stock markets. At least temporarily.
But eventually, it’s the earnings of Indian companies that really counts. Here i will tell you about some really interesting things…
The Overall total profit of all profit-making Indian companies if you clubbed together was around Rs 4.3 trillion in the year 2016. The losses of the loss-making organizations once totaled 450 bn.
So, India’s net corporate earnings that year was around Rs 3.8 trillion.
Saudi, United States Companies Eyeing Huge Stakes in Mumbai Based Next-Generation Technology Company; which is Creating Synergies by Integrating India’s Digital Ecosystem
In 2020, our total corporate profit is lower than Rs 3.8 trillion. It is not because the profit-making companies are facing tough times and struggling to get more profits and market share. But they have grown by around 35% since 2016. But the real shocker is the Loss-making company’s losses have shot up 6 times or 500% in 2020.
If you do research than it is very simple and easy to understand because there wide areas of sectors like telecom, Aviation, real estate, power, commodities, Tourism, hospitality, textile, Hotels, public sector banks, and Infrastructure are new joiners in the list to the pile of losses.
If you really think that Sensex 40,000 is Just a Mere Illusion and it is conquered and achieved on the contributions of massively higher profits of a handful of Indian Organizations.
So, the United States election results may have a minimal impact on the valuations of such good profit-making companies stocks. But primarily, it’s the profitability factor of the larger corporates and organizations in India that will really transform the fortune of our stock markets.
Just yesterday we had just finished The United States Presidential Elections and now waiting for the Outcomes and once all this huge game of volatility is over. We Could see the United States equities market also heading for another after a euphoric rise from the March 23 bottom, are stocks finally returning to rational behavior? Are we going to witness another substantial decline in the coming times?
A couple of Market Experts are feeling more concerned and also what is more worrying for investors is that even businesses reopening their doors for customers across India, demand is very low and tepid as Indian consumers are saving more, spending less, and sitting on cash.
As we can see that pent-up demand is not coming back to normal levels. There is no fresh demand in the market, which everyone is discussing. People are very skeptical about spending because they need money for the worst uncertain times and emergencies.
And also due to the shutdown, MSMEs will be the biggest affected sector, and as per the situation lot of companies will declare bankruptcy or may not reopen again. If you want to witness the real scenario of Defaults, if any, it will be known only after 5-6 months.
Stock Market Lesson from Past Recessions
Stock market Bull Runs during the depression and recessionary times are very normal as the northern migration of birds in the springtime. This gigantic rally in the last 6 months was consistent despite a huge fall in GDP numbers and a post-depression, all time record high unemployment rate. Usually, Stocks do not always follow the macros of the economy, however during certain periods it will march to its own drumbeat, just eliminating the fundamental facts and data. When this happens, the rally is often based on the degree of loss. In simple terms, a Bigger loss equals a Bigger rebound. That is the real scenario that seems to be the case here.
Do you really think that Did stocks reach their Final bottom on March 23? Perhaps, but I’m not at all convinced. Do you know Why?
When you do in-depth research in the previous 14 recessions starting with the Great Depression, the shortest amount of time stocks reached as far down as possible was during the downturn of 1945. In those days, stocks bottomed out on day 53, which was about 22% into the downturn. The normal timeframe it took for the Dow to arrive at its absolute bottom during a downturn was 61%. At the end of the day, if a downturn kept going 100 days, and stocks hit their absolute bottom on day 61, at that point, it tends to be said that stocks bottomed out the downturn was 61% finished.
In Nine of the previous Fourteen recessions, Equity Markets bottomed out in the second half of the recession. In 6 of them, stocks didn’t hit bottom until the recession was over 80% complete. Have we hit bottom yet? I tend to believe we have not. But only time will tell if this is correct.
As per view from research, study, and findings, I will say that Any bear run has multiple legs. We saw Nifty drop to 7,500 level and then we saw a sharp recovery till 12050 in October. Now as per my view the second leg of the fall is just going to start so be aware, alert, and Cautious.