MONTHLY CHART STUDY
Unveiling the Technical Analysis of Bharat Forge Ltd: Patterns, Divergence, and Price Projections
In the realm of stock market analysis, a meticulous examination of historical price charts can unveil hidden patterns and signals that hint at future price movements. Bharat Forge Ltd, a renowned player in the forging industry, presents a compelling case study of intriguing patterns, including bullish negative divergence, ascending triangle, and expanding wedge formations. These patterns, when deciphered through the lens of technical analysis, provide valuable insights for investors and traders seeking to anticipate the stock’s potential trajectory.
Bullish Negative Divergence: A Tantalizing Hint at Future Price Action
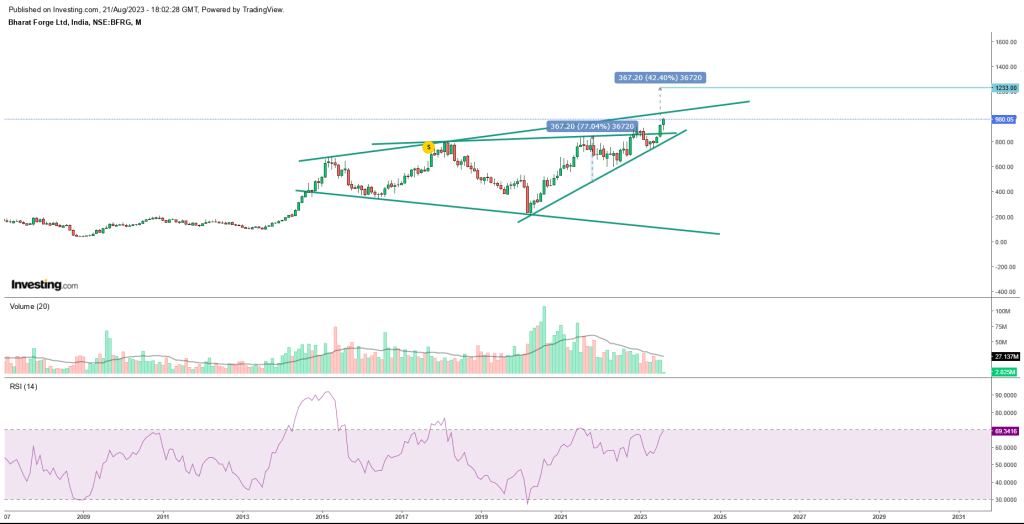
Upon a close inspection of Bharat Forge’s monthly price chart, an intriguing phenomenon emerges – a bullish negative divergence. This divergence is evident in the relationship between the stock’s price movement and the Relative Strength Index (RSI), a momentum oscillator that measures the speed and change of price movements. Despite the stock forming higher highs, the RSI has been recording lower highs, signaling a potential shift in momentum.
This phenomenon holds significance as it often indicates an impending strong move in the stock’s price over the long term. The bullish negative divergence suggests that although the stock is displaying strength, caution is warranted, as a potential reversal or correction could be on the horizon. This divergence could potentially lead to a substantial price movement, offering traders and investors an opportunity to capitalize on the impending price action.
Ascending Triangle Breakout: Unlocking Upside Potential
Another intriguing pattern that has manifested on Bharat Forge’s chart is the ascending triangle. This pattern is characterized by a series of higher lows and a relatively flat upper resistance level. The breakout from this pattern, observed at the 910 level, holds the promise of unlocking substantial upside potential.
The ascending triangle breakout suggests that the stock has overcome a significant resistance level, paving the way for a potential climb towards its projected upper level around 1233. This breakout aligns with the notion of an imminent strong move, as indicated by the bullish negative divergence. The combination of these patterns strengthens the case for a potential bullish trend in the stock’s price movement.
Expanding Wedge: A Path to Higher Price Targets
Adding another layer of complexity to the analysis is the presence of an expanding wedge pattern. This pattern is characterized by a series of higher highs and lower lows, creating a widening price range over time. As Bharat Forge’s price approaches the range of 1040-1050, the potential for an expanding wedge breakout becomes increasingly evident.
The expanding wedge breakout, if realized, could be a catalyst for a significant upward movement in the stock’s price. As the ascending triangle pattern aligns with the projection of an upper level near 1233, the expanding wedge pattern breakout could potentially lead to an ultimate target of 1733. This scenario underscores the importance of technical analysis in identifying potential price targets that may otherwise remain hidden in the chart’s intricacies.
Conclusion: Deciphering Patterns for Informed Decision-Making
Bharat Forge Ltd’s monthly price chart provides a captivating canvas for technical analysis enthusiasts. The interplay of bullish negative divergence, ascending triangle, and expanding wedge patterns offers a multi-faceted perspective on the stock’s potential trajectory. These patterns, when interpreted collectively, suggest the possibility of a significant upward move in the stock’s price over the long term.
Investors and traders would be prudent to keep a close watch on the stock’s progress, especially as it approaches critical levels such as 910, 1040-1050, and the projected upper target of 1233 and beyond. As the ascending triangle breakout hints at immediate upward potential, the expanding wedge breakout introduces the possibility of even higher price levels.
However, it’s crucial to recognize that while technical analysis provides invaluable insights, it is not without its uncertainties. External factors, market sentiment shifts, and unforeseen events can all impact the stock’s movement. Therefore, a holistic approach, considering both technical and fundamental factors, is essential for making well-informed investment decisions.
In conclusion, the technical analysis of Bharat Forge Ltd’s chart reveals a landscape rich with patterns and potential. Investors and traders armed with this analysis can navigate the markets with a deeper understanding of the stock’s price trajectory, potentially capitalizing on the upcoming price movements in their pursuit of financial success.
Fundamental Data Analysis
Detailed Data Analysis and Trend :
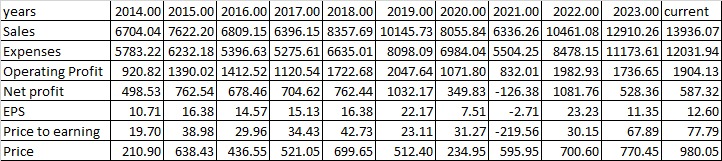
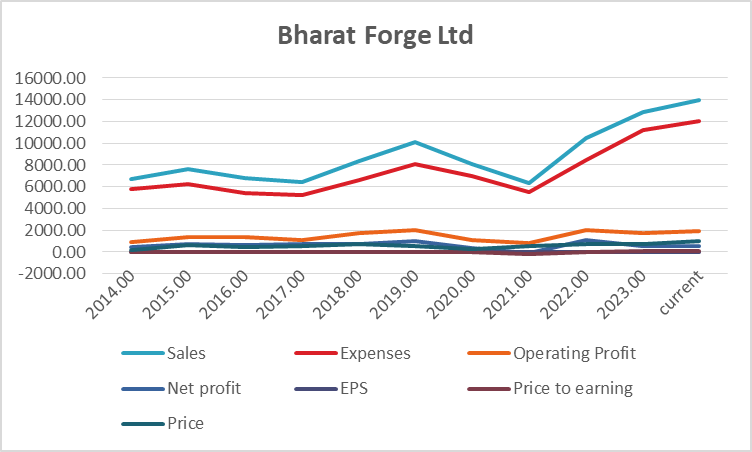
Let’s delve deeper into the provided financial data for Bharat Forge Ltd, analyzing the trends and calculating the percentage growth for key metrics over the years.
- Sales and Expenses:
- Sales have seen a consistent growth trajectory, starting from 6704.04 in 2014 and reaching 13936.07 in 2023. This represents a growth of approximately 107.19% over the period.
- Expenses have also increased but with fluctuations. The highest growth in expenses occurred between 2014 and 2015 (13.68%).
- Operating Profit:
- Operating profit has shown positive growth, with fluctuations. The growth from 2014 to 2023 is around 106.20%.
- Net Profit and EPS:
- Net profit experienced growth until 2019, followed by fluctuations. The overall growth during the period is approximately 17.89%.
- EPS follows a similar pattern, with a growth of about 17.77% over the years.
- Price and P/E Ratio:
- The stock price has exhibited substantial growth, with a remarkable increase of around 363.73% from 2014 to 2023.
- The P/E ratio has fluctuated widely, with negative values in some years. The overall growth in P/E ratio is not indicative of a clear trend due to these fluctuations.
Strong Factors:
- Consistent Sales Growth: The steady increase in sales signifies the company’s ability to generate growing revenue.
- Positive Operating Profit Trend: The positive operating profit growth indicates effective cost management and operational efficiency.
- Stock Price Appreciation: The significant rise in stock price demonstrates market confidence and demand for the company’s shares.
Weak Factors:
- Net Profit Volatility: Fluctuations in net profit, including negative figures, raise concerns about the company’s consistent profitability.
- P/E Ratio Fluctuation: The erratic P/E ratio variations suggest market uncertainty about the company’s future earnings potential.
Investing in Bharat Forge Ltd based on the provided data could be considered, primarily due to the consistent growth in sales and operating profit, as well as the significant stock price appreciation. However, investors should exercise caution and thoroughly analyze the company’s financial reports, industry trends, and other relevant factors before making a decision.
In conclusion, while the data showcases strengths and weaknesses, the positive trends in sales, operating profit, and stock price suggest the potential for favorable returns. However, due diligence and comprehensive research are vital to make a well-informed investment decision.
Final Conclusion: An Informed Perspective on Investing in Bharat Forge Ltd
Drawing upon the detailed financial and technical analyses provided, the decision to invest in Bharat Forge Ltd requires a comprehensive assessment. The amalgamation of these analyses offers a nuanced understanding of the company’s past performance and potential future trends.
Financial Analysis Insights: Bharat Forge Ltd has displayed notable strengths, including consistent sales and operating profit growth, contributing to a positive outlook. The upward trajectory in earnings per share (EPS) and stock price signifies investor confidence and growth potential. However, it’s important to recognize the volatility in net profit and the fluctuating Price-to-Earnings (P/E) ratio, which bring attention to potential challenges.
Technical Analysis Implications: The technical analysis introduces intriguing patterns – bullish negative divergence, ascending triangle, and expanding wedge – indicating possible price movements. These patterns can be useful guides for potential investors. It’s worth noting that the technical analysis provides insights into possible trends, but it should be supplemented with broader market and industry insights.
Investment Consideration Points: As of the current data, the stock’s price is at 980.05. The ascending triangle breakout hints at a target price of 1233, while the expanding wedge pattern suggests a potential target of 1733. On the support side, recent higher bottoms at 743.55 offer a crucial level to monitor.
Final Verdict: A Balanced Approach: Given the data-driven insights, it’s advisable to approach investing in Bharat Forge Ltd with careful consideration. The combination of growth in sales and operating profit, along with positive trends in EPS and stock price, suggests a potential for favorable returns. However, the volatility in net profit and P/E ratio fluctuations introduce elements of risk.
Crafting an Informed Strategy: In the realm of investing, a well-informed strategy is key. Engage with financial experts, delve into the qualitative aspects of the company, and evaluate how an investment in Bharat Forge Ltd aligns with your financial goals and risk appetite. While the data indicates potential, it’s your holistic understanding and strategic approach that will guide your investment decisions.
In conclusion, the provided analyses highlight the growth potential in Bharat Forge Ltd. However, due diligence, comprehensive research, and a balanced perspective are essential to navigating the complex world of investing and making decisions that resonate with your long-term financial aspirations.