MONTHLY CHART STUDY
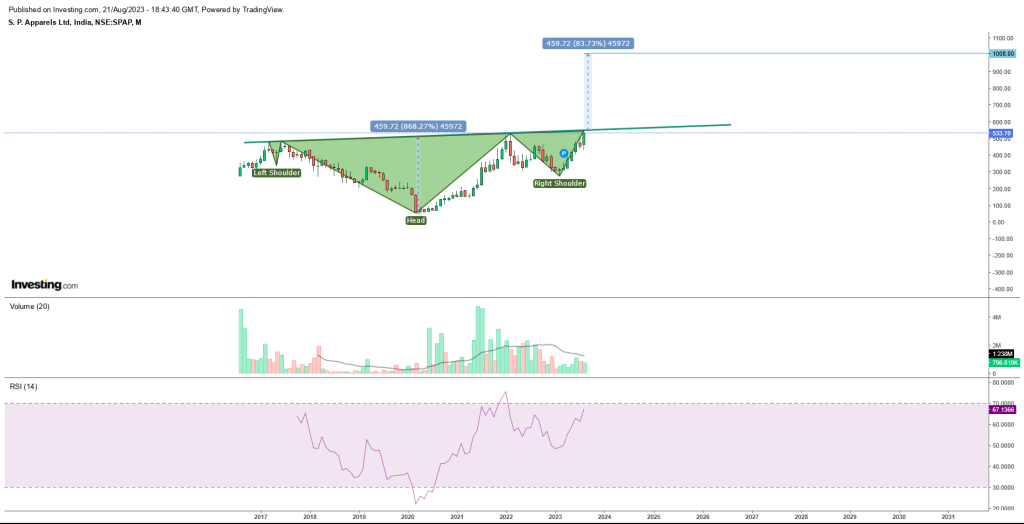
The analysis of the stock’s current trading position and the potential formation of an “inverted head and shoulder” pattern on the monthly chart is a compelling insight into the stock’s future prospects. This pattern, combined with the observations of resistance levels and RSI divergence, presents an intriguing case for a significant breakout in the stock’s value.
The price movement of the stock seems to be at a critical juncture, as it hovers near the resistance line. The identification of an “inverted head and shoulder” pattern on the monthly chart indicates a potential reversal of the prevailing downtrend. This pattern typically signifies a shift from a bearish trend to a bullish one, signifying a change in market sentiment and expectations.
Key to this analysis is the neckline breakout point, which lies in the 550-555 zone. This level holds significant importance as it aligns with the previous high of 530.90, and more recently, the stock reached a high of 548.55. The convergence of these levels suggests a consolidation and accumulation of buying interest around this range.
Adding further weight to this potential breakout scenario is the relative strength index (RSI). Despite the stock’s recent high of 548.55, the RSI remains at lower levels in comparison. This divergence between price action and RSI signifies a positive momentum shift, indicating that buyers are becoming more active even as the stock hasn’t reached its previous peak.
The bullish divergence observed in conjunction with the “inverted head and shoulder” pattern suggests that the stock is poised for a significant price surge. Should the breakout above the 555 level be confirmed, it could mark a watershed moment for this particular stock, potentially setting the stage for an unprecedented upswing.
In terms of price projection, a successful breakout could lead to substantial gains. The initial targets of 1008, 1600, and even 2300 present tantalizing prospects for investors. These projections are grounded in the assumption that the price would maintain its upward trajectory, following the trend set by the breakout. Of course, such projections come with the caveat that market dynamics can change rapidly, and continuous patterns must indeed materialize to sustain this bullish momentum.
It’s crucial to acknowledge that while technical analysis provides valuable insights into potential price movements, it’s not a foolproof science. Market sentiment, broader economic trends, and unforeseen events can all impact stock prices. As such, it’s important for investors to consider this analysis alongside a holistic view of the stock market and the company’s fundamentals.
In conclusion, the “inverted head and shoulder” pattern forming on the monthly chart, combined with the resistance levels, RSI divergence, and breakout potential at the 550-555 zone, paints an exciting picture for the stock’s future. The possibility of a breakout above these levels opens the door to substantial gains, with price targets reaching as high as 2300. However, prudent investors must be mindful of market volatility and evolving trends as they make decisions based on this analysis. As the stock teeters on the edge of a potential breakout, the coming months will undoubtedly be a critical period to watch closely.
Fundamental Data analysis
Financial Data Analysis:
1. Sales Growth Trend:
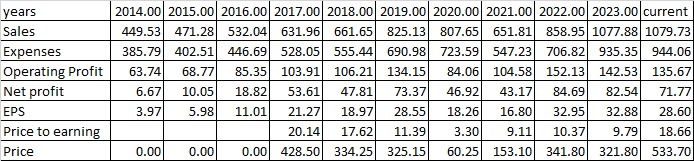
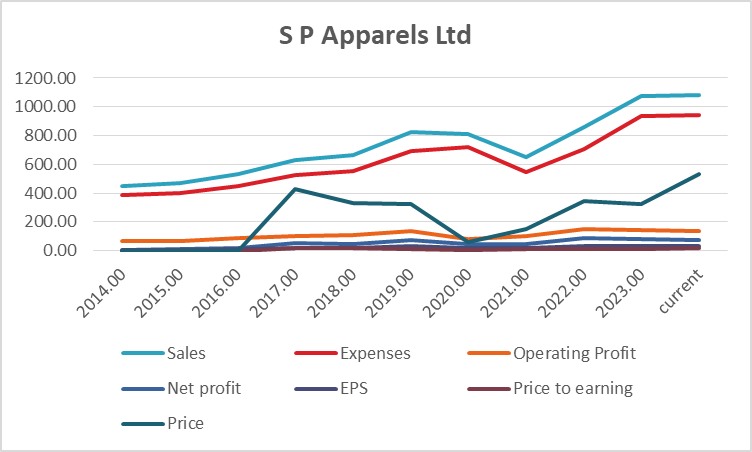
- The company’s sales have shown consistent growth over the years, starting from 2014 at 449.53 and reaching 1079.73 in the current year (2023).
- This represents an overall growth of approximately 140% from 2014 to 2023.
2. Expenses Trend:
- Similarly, expenses have increased over the years, indicating business expansion and operations growth.
- The expenses in 2023 are 2.5 times higher than those in 2014.
3. Operating Profit Trend:
- Operating profit has generally followed an upward trajectory, with some fluctuations.
- It’s noteworthy that operating profit dropped significantly in 2020, likely due to the impact of external factors (possibly COVID-19), but recovered in subsequent years.
- The operating profit in 2023 is nearly twice that of 2014.
4. Net Profit Trend:
- Net profit has shown a remarkable increase, starting at 6.67 in 2014 and reaching 71.77 in 2023.
- The net profit has grown by more than 10 times over this period.
5. Earnings Per Share (EPS) Trend:
- EPS has seen consistent growth over the years, reflecting the company’s increasing profitability.
- EPS has grown from 3.97 in 2014 to 28.60 in 2023.
6. Price to Earnings (P/E) Ratio Trend:
- The P/E ratio, which measures the stock’s valuation relative to its earnings, has varied over the years.
- It reached its peak in 2015 at 20.14 and then declined significantly to 3.30 in 2017, suggesting an undervaluation.
- The P/E ratio has been relatively stable in recent years, indicating a consistent valuation.
7. Stock Price Trend:
- The stock price has exhibited substantial fluctuations over the years.
- It plummeted in 2016, possibly due to market sentiment, but then demonstrated a remarkable recovery.
- The stock price surged from 60.25 in 2020 to 533.70 in 2023, indicating a substantial growth of over 780% in just three years.
Turnaround Factors:
- The company has witnessed a significant turnaround in its financial performance, transitioning from lower profits in the earlier years to substantial profits in recent years.
- This turnaround could be attributed to factors such as improved operational efficiency, increased sales, cost optimization, and possibly strategic changes.
Strong Factors:
- Consistent growth in sales, operating profit, and net profit indicates the company’s ability to generate revenue and manage costs effectively.
- The substantial increase in EPS demonstrates improved earnings on a per-share basis.
- The undervalued P/E ratio in 2017 and subsequent stability suggests favorable valuations.
Weak Factors:
- Fluctuations in stock price and P/E ratio in earlier years might have caused uncertainty among investors.
Conclusion: Based solely on the provided financial data, S P Apparels Ltd appears to be a compelling investment opportunity. The company has demonstrated consistent growth in sales, profit, and EPS over the years. The remarkable turnaround from lower profits to substantial profits is indicative of effective operational management. The undervalued P/E ratio in 2017 and subsequent stability could imply favorable valuations. However, investors should consider the historical stock price volatility and the influence of external market factors.
It’s important to note that investing decisions should not be based solely on past performance and financial data. Other factors such as industry trends, competition, management quality, economic conditions, and future growth prospects should also be taken into account. This analysis provides a snapshot of the company’s historical performance, but comprehensive due diligence is essential before making any investment decisions.
Final Outlook
Conclusion:
After a comprehensive analysis of both the financial and technical aspects of S P Apparels Ltd, a favorable investment opportunity emerges. The company’s consistent growth in sales, operating profit, and net profit showcases its financial resilience and effective operational management. The turnaround from previous years’ lower profits to current substantial earnings underscores its adaptability and strategic prowess.
Technically, the “inverted head and shoulders” pattern on the monthly chart signals a potential trend reversal. Anticipating a neckline breakout in the 550-555 range, the stock’s price movement could enter a new upward phase. The bullish divergence in the Relative Strength Index (RSI) further strengthens the outlook for an impending breakout.
Considering these factors, investors may find it prudent to consider entering a position in S P Apparels Ltd. A possible entry point could be upon confirmation of the neckline breakout at or above the 555 level. This confirmation would indicate a strong signal of upward momentum and a potential breakout from the current resistance.
For those looking to capitalize on this opportunity, the target levels are significant. If the breakout occurs as anticipated, the stock could potentially target levels of 1008, 1600, and even 2300 over the coming years. These levels represent substantial potential growth from the current stock price.
In terms of support, investors should monitor the 550-555 zone. This range not only represents the neckline breakout level but also serves as a crucial support zone. Any price retracements that stay above this level could reinforce the strength of the breakout.
In conclusion, based on the provided financial and technical analysis, S P Apparels Ltd holds the potential for a lucrative investment. Its impressive financial performance combined with the technical signals of a breakout make it an attractive option. However, prudent investors should conduct their due diligence, stay informed about market developments, and consider a long-term investment horizon to fully realize the benefits of this investment opportunity.