Bharat Heavy Electricals Limited (BHEL) – Powering India’s Progress
harat Heavy Electricals Limited (BHEL) is one of India’s largest and most prominent engineering and manufacturing companies in the field of power generation, transmission, and transportation. Founded in 1964, BHEL has played a pivotal role in the development of India’s infrastructure and industrial sector. As of my last knowledge update in September 2021, here is an overview of BHEL and its key aspects:
1. Company Background: BHEL was established as a government-owned enterprise under the Ministry of Heavy Industries and Public Enterprises, and it is headquartered in New Delhi, India. The company was set up to meet the growing demand for power equipment and industrial machinery in India and abroad.
2. Core Business Areas: BHEL primarily operates in three major business segments:
a. Power: BHEL is renowned for its expertise in designing, manufacturing, and supplying a wide range of power generation equipment, including steam turbines, gas turbines, boilers, generators, and control systems. The company has contributed significantly to India’s power generation capacity, playing a pivotal role in the country’s energy security.
b. Industry: BHEL provides solutions for various industrial applications, including petrochemicals, chemicals, cement, paper, sugar, and more. They manufacture industrial equipment, such as compressors, heat exchangers, valves, and transformers, catering to diverse industries.
c. Transportation: BHEL is also involved in the manufacture of electric locomotives, rolling stock, and traction motors for the Indian Railways, contributing to the modernization of India’s transportation infrastructure.
3. Manufacturing and Facilities: BHEL has a robust manufacturing infrastructure with multiple manufacturing units and facilities spread across India. Some of its key manufacturing units are located in cities like Haridwar, Hyderabad, Bhopal, Trichy, and Ranipet, among others. These units are equipped with state-of-the-art technology and are capable of producing a wide range of power and industrial equipment.
4. Research and Development: BHEL has a strong focus on research and development (R&D) to continually innovate and improve its products and services. The company has established several R&D centers and collaborations with academic institutions to drive technological advancements in the energy and industrial sectors.
5. Global Presence: While BHEL primarily serves the Indian market, it has also made its mark on the international stage. The company exports its products and services to over 82 countries, contributing to India’s export revenue and establishing itself as a global player in the power and engineering industry.
6. Sustainability and Environmental Initiatives: BHEL is committed to environmental sustainability and has been actively involved in the development and implementation of cleaner and more energy-efficient technologies. It has ventured into renewable energy sources like solar and wind power and has taken steps to reduce its carbon footprint.
7. Financial Performance: BHEL’s financial performance has been subject to fluctuations due to market conditions, policy changes, and competition. However, the company has consistently remained a significant player in India’s power and industrial sectors.
8. Challenges and Future Outlook: As of 2021, BHEL faced challenges related to competition from private sector players and the need to adapt to evolving energy and industrial trends. The company was exploring diversification into emerging areas such as electric vehicle (EV) charging infrastructure and digital solutions.
In conclusion, Bharat Heavy Electricals Limited (BHEL) has been a key player in India’s industrial and power sectors for decades. Its contributions to infrastructure development, technological innovation, and its commitment to sustainability have cemented its position as a crucial entity in India’s growth story. However, the company has also faced challenges in a changing market environment and is actively working on diversification and modernization to remain relevant in the future. For the most up-to-date information, I recommend checking BHEL’s official website and recent news sources.
Technical chart study
Technical Analysis of Bharat Heavy Electricals Ltd (BHEL) Stock Chart
In this comprehensive analysis of BHEL’s stock chart, we aim to decipher the key trends and potential turning points by examining historical price movements, patterns, and volume dynamics.
1. Historical Price Movements: BHEL’s stock chart reveals an intriguing journey that spans several years, offering valuable insights into its price dynamics. It’s crucial to begin by acknowledging the pivotal moments that have shaped the stock’s trajectory.
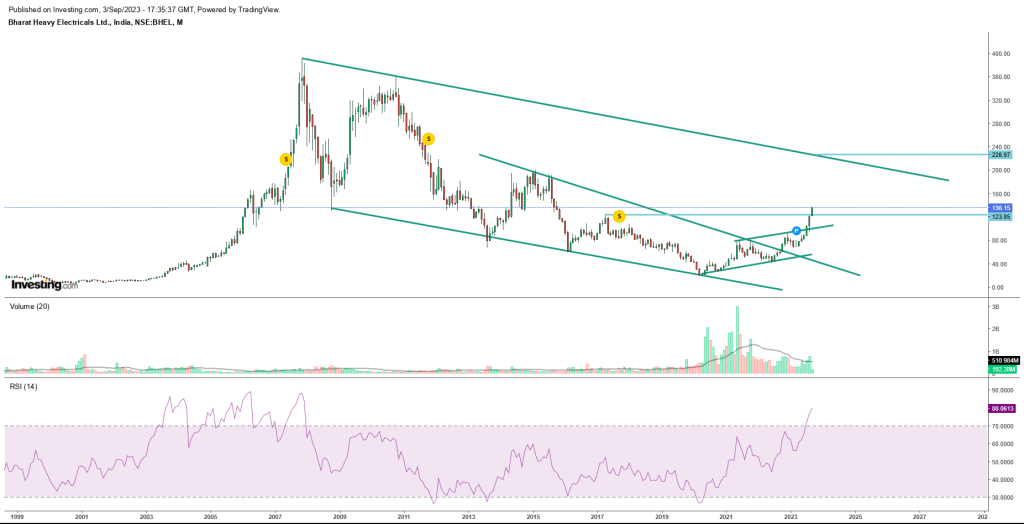
In 2007, BHEL reached its zenith, touching a peak of Rs. 390 per share. However, what followed was a prolonged descent characterized by a series of lower highs and lower lows, indicative of a clear downtrend. This bearish trend persisted for years, culminating in a significant bottoming out near the Rs. 18 level in 2020.
2. Signs of Accumulation and Change: One of the most intriguing aspects of BHEL’s chart is the emergence of a pattern that suggests a potential trend reversal. After the stock hit rock bottom in 2020, there was a notable increase in trading volume, signaling a significant accumulation of shares. Such accumulation, coupled with subsequent price movements, often foreshadows a shift in market sentiment.
More recently, BHEL exhibited a remarkable breakthrough. It managed to breach the confines of its lower highs, surpassing the previous resistance level at Rs. 122. This is a critical development as it implies that the stock has the potential to break free from its historical downtrend.
3. Chart Patterns and Targets: Furthermore, a closer examination of the chart reveals that BHEL was ensnared within a falling wedge pattern, which is generally a bullish sign. The stock successfully executed a breakout from this pattern around the Rs. 75 mark and even achieved its projected target.
However, when considering a broader perspective encompassing the stock’s historical high and low points, there is room for optimism. BHEL may have the potential to extend its upward trajectory, with the possibility of reaching levels as high as Rs. 226 and beyond.
Adding to the optimism, the stock has recently embarked on a journey characterized by higher lows and higher highs. This pattern is indicative of an emerging uptrend and is further confirmed by the breakout from a rising channel formation, as highlighted in the chart.
4. Conclusion and Price Levels to Watch: In conclusion, the technical analysis of BHEL’s stock chart presents a compelling case for a potential trend change. Several indicators, including the break of the lower highs, volume accumulation, and the emergence of bullish chart patterns, suggest that the stock could be on the cusp of a sustained uptrend.
For investors and traders, it’s worth noting that a strong buy zone appears to be in the range of Rs. 100 to Rs. 130, with a robust support level at Rs. 75. If the bullish momentum continues, the stock could target price levels of Rs. 226, Rs. 350, and even Rs. 500 in the future.
However, it’s essential to exercise caution and conduct thorough due diligence before making any investment decisions. Technical analysis provides valuable insights, but it should be complemented by a broader assessment of fundamental factors and market conditions.
Keep in mind that the stock market is influenced by a myriad of factors, and past performance is not always indicative of future results. Therefore, prudent risk management and a well-defined investment strategy are essential when considering opportunities in the stock market.
Fundamental and data analysis
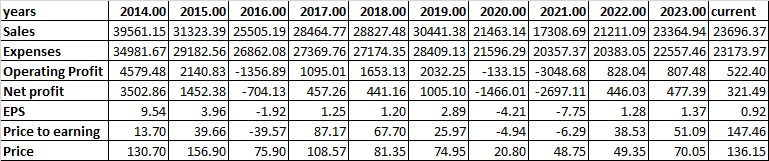
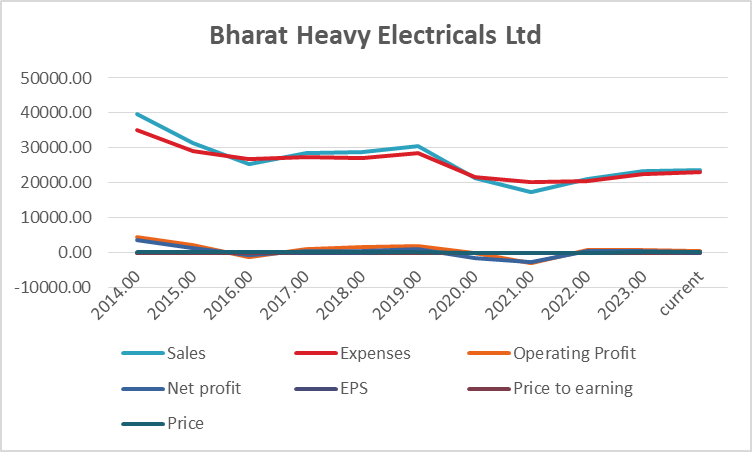
Data Analysis for the Company’s Financials (2014-2023):
- Sales Growth: The company’s sales have shown a volatile trend over the years. Sales declined from 2014 to 2016, hit a low in 2020, but then showed a significant recovery in 2021 and 2022. The current sales figure for 2023 indicates a slight increase.
- Expenses: Despite fluctuations, expenses have generally increased over the years, with some exceptions. However, in 2023, there seems to be a notable increase in expenses compared to the previous year.
- Operating Profit: The operating profit experienced a negative trend from 2016 to 2020, but it started recovering in 2021 and 2022. However, in 2023, it declined again, although it remains positive.
- Net Profit: Similar to operating profit, net profit was negative in 2020 but rebounded in 2021 and 2022. However, it decreased again in 2023.
- Earnings Per Share (EPS): EPS followed a similar pattern, with a negative trend in 2020 and subsequent recovery. However, it decreased in 2023.
- Price to Earnings (P/E) Ratio: The P/E ratio fluctuated significantly over the years, indicating varying investor sentiment. Notably, it became negative in 2016, indicating a loss for that year.
- Stock Price: The stock price has also been volatile, with significant fluctuations over the years. It experienced substantial growth in 2023.
Trends and Factors:
Strong Factors:
- Sales Recovery: The recent recovery in sales in 2021 and 2022 is a positive sign, indicating potential growth.
- Positive Operating Profit: Despite the fluctuations, the company has managed to maintain a positive operating profit.
- Improving EPS: Although there are fluctuations, the EPS improved in 2021 and 2022 compared to the previous years.
- Low Price in 2020: The stock had a low price in 2020, making it an attractive entry point for investors who believe in its potential for recovery.
Weak Factors:
- Fluctuating Profits: The company has shown inconsistent net profits over the years, with negative results in 2020 and 2023.
- High P/E Ratio: The P/E ratio has been quite volatile, with some years showing negative values, which can be a cause for concern.
- Rising Expenses: The increase in expenses in 2023 without a corresponding increase in sales or profits is a concerning factor.
Turnaround Factors:
The key turnaround factors for the company appear to be the recovery in sales, positive operating profit, and an improving EPS from 2021 onwards. The low stock price in 2020 could also be seen as a potential turnaround point.
Conclusion:
Based on the provided data, it’s important to consider the following:
- The company has shown signs of recovery in recent years, with improving sales and profitability.
- The stock had a significant price increase in 2023, indicating positive investor sentiment.
- The P/E ratio, while volatile, has been positive in recent years, suggesting that investors have confidence in the company’s future prospects.
However, there are concerns regarding fluctuating profits, rising expenses in 2023, and the overall volatility of the stock and financial metrics.
Investing in this stock could be considered based on the recent positive trends, but it carries a degree of risk due to historical volatility and fluctuating financials. It’s essential for potential investors to conduct further research, consider the company’s industry and competitive position, and assess whether they are comfortable with the associated risks before making an investment decision. Additionally, consulting with a financial advisor is advisable to make an informed investment choice.
Technofunda view of stock
Based on the financial and technical analysis provided, here is the final conclusion:
Conclusion:
Considering the financial and technical analysis, there are several key takeaways:
- Financial Recovery: The company has displayed signs of financial recovery, with improving sales, positive operating profit, and an uptick in earnings per share (EPS) since 2021.
- Stock Price Momentum: The stock has experienced a substantial price increase in 2023, indicating positive market sentiment and potential bullish momentum.
- Cautionary Factors: However, it’s important to note the historical volatility in the stock price and the fluctuating financial metrics, including net profit and expenses.
Given these observations, here is a concise investment recommendation:
Buy Level: Investors with a high-risk tolerance and a belief in the company’s recovery potential may consider entering at or near the breakout level, which is around the recent stock price of Rs. 136.15.
Target Level: The target level for this investment could be set at Rs. 226, which aligns with potential future growth based on the historical price trend.
Support Level: Investors should establish a strong support level at Rs. 100 to manage potential downside risk. This level provides a buffer against market fluctuations.
It’s essential to approach this investment with caution, as the stock has a history of volatility. Investors should conduct further due diligence, consider their risk tolerance, and consult with a financial advisor before making any investment decisions. This recommendation is based solely on the data and analysis provided and does not take into account broader market conditions or external factors that may impact the stock’s performance.