Company Overview
Godavari Drugs Ltd is a pharmaceutical company headquartered in Hyderabad, India. It was founded in 1987 and has since established itself as a prominent player in the pharmaceutical industry, both in India and internationally.
Key Highlights:
- Product Range: Godavari Drugs Ltd is known for its diverse portfolio of pharmaceutical products. They manufacture a wide range of active pharmaceutical ingredients (APIs), intermediates, and formulations across various therapeutic categories. These products cater to domestic and international markets.
- Research and Development: The company emphasizes research and development (R&D) activities to enhance its product offerings and stay competitive in the pharmaceutical market. R&D efforts are focused on developing new drugs, improving existing formulations, and optimizing manufacturing processes.
- Quality Assurance: Godavari Drugs Ltd is committed to maintaining high-quality standards across its product range. The company follows stringent quality control measures and has received certifications from regulatory authorities, affirming its compliance with international quality standards.
- Global Presence: The company has a global footprint and exports its products to numerous countries worldwide. It has established a strong presence in markets across Asia, Europe, North America, and other regions, making it a significant player in the global pharmaceutical industry.
- Environmental Responsibility: Godavari Drugs Ltd is known for its commitment to environmental sustainability. It has implemented eco-friendly practices in its manufacturing units and strives to reduce its environmental impact in line with global efforts to promote sustainable pharmaceutical manufacturing.
- Corporate Social Responsibility (CSR): Beyond its business operations, the company is actively engaged in CSR initiatives. These efforts include healthcare outreach, educational support, and community development projects aimed at giving back to the communities where it operates.
- Vision and Growth: The company’s vision is to be a leading player in the global pharmaceutical industry by focusing on research-driven innovation, sustainability, and social responsibility. Godavari Drugs Ltd aims to expand its product portfolio, increase its market share, and establish itself as a trusted provider of healthcare solutions worldwide.
- Industry Recognition: Over the years, Godavari Drugs Ltd has received recognition and awards for its contributions to the pharmaceutical sector, including accolades for excellence in manufacturing quality control, and export performance.
Technical analysis of Chart
Technical Analysis of Godavari Drugs Ltd: A Path to Potential Upside
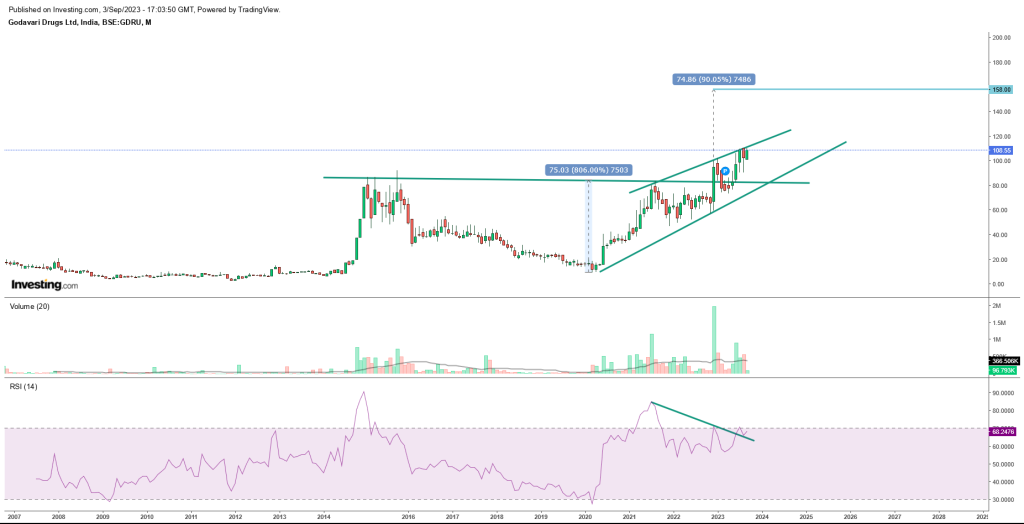
Technical analysis is a valuable tool for investors and traders, helping to make informed decisions based on historical price movements and patterns. In the case of Godavari Drugs Ltd, the monthly chart reveals intriguing patterns that suggest the stock may be on the cusp of a significant upward move.
Pattern Recognition: Inverted Head and Shoulders or Cup and Handle?
Upon careful examination of the monthly chart, it becomes evident that Godavari Drugs Ltd has formed what could be interpreted as either an inverted head and shoulders pattern or a cup and handle pattern. Both patterns share similar indications and price targets, providing a strong basis for analysis.
The breakout at the 92 level, followed by a move to 102, is a notable development. Even more significant is the subsequent retest of the neckline at 82, which was successfully followed by a resumption of the original upward trend after crossing the 102 threshold. This confirmation of the pattern is a positive sign for potential future gains.
Price Targets and Potential Upside:
The breakout from the 92-102 range suggests that the stock has a promising upside potential. Based on the pattern analysis, a target price range of 158-200-300 seems plausible. However, it’s important to remember that technical patterns are not guarantees of future performance, and other factors such as market sentiment and fundamental analysis should also be considered.
Bullish Negative Divergence: Adding to the Conviction
Another intriguing aspect of this analysis is the presence of a “Bullish Negative Divergence.” This divergence is a powerful indicator of potential price action, especially when it appears on a long-term chart. In this case, the divergence between the stock’s bullish trend and the divergence between price and RSI (Relative Strength Index) confirms at the 102 price point.
Divergences are essential in technical analysis because they often precede significant price movements. In this instance, the bullish negative divergence suggests that despite the stock’s bullish momentum, there may be even more substantial price action on the horizon.
Support and Resistance Zones:
While the technical patterns are promising, it’s essential to consider support and resistance levels. The stock is currently trading within a rising channel, encountering resistance in the vicinity of 110-111. As such, this zone presents a strong buying opportunity, particularly if the stock manages to break out above this level.
On the downside, the 70 level serves as a robust support zone. It’s crucial for investors and traders to monitor these support and resistance levels carefully, as they can provide valuable entry and exit points.
Conclusion: The Path Forward for Godavari Drugs Ltd
In conclusion, the technical analysis of Godavari Drugs Ltd suggests a potential path to upside gains. The formation of inverted head and shoulders or cup and handle patterns, coupled with the bullish negative divergence, point to a positive outlook for the stock.
However, it’s essential to approach technical analysis with a holistic view, incorporating other factors such as market conditions and fundamental analysis into your decision-making process. Technical patterns can provide valuable insights, but they should be used in conjunction with a comprehensive investment strategy.
Investors and traders should consider the 92-102 range as a potential entry point, with the expectation of an upside move towards the 158-200-300 range. Additionally, closely monitoring support at 70 and resistance at 110-111 will be critical for managing risk and optimizing returns in the coming months.
As always, it’s advisable to consult with a financial advisor or conduct further research before making investment decisions based on technical analysis.
Fundamental Data analysis
Revenue and Profitability Analysis:
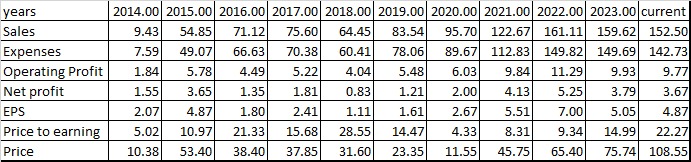
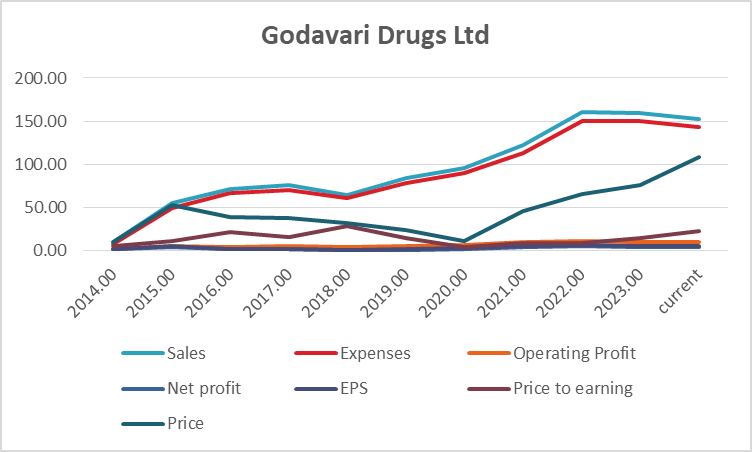
- Sales Growth: The company has shown consistent growth in sales revenue from 9.43 in 2014 to 152.50 in the current year (2023). This represents a substantial increase, indicating strong top-line growth.
- Expenses: While expenses have also increased, the growth rate is in line with revenue growth. This suggests that the company has been able to manage its costs effectively.
- Operating Profit: Operating profit has shown a steady increase over the years, reflecting the company’s ability to maintain profitability even as it expands.
- Net Profit: Net profit has generally followed an upward trajectory, indicating improved profitability. However, there was a slight dip in 2020, likely due to the impact of external factors such as the COVID-19 pandemic.
- Earnings Per Share (EPS): EPS has increased steadily from 2.07 in 2014 to 4.87 in 2022. This demonstrates the company’s ability to generate earnings for its shareholders.
Valuation Metrics:
- Price-to-Earnings (P/E) Ratio: The P/E ratio shows how the market values the company relative to its earnings. It has fluctuated over the years, with a significant decrease in 2020 and subsequent recovery. A lower P/E ratio may indicate an undervalued stock.
- Price: The stock price has shown volatility over the years but has seen substantial growth from 2014 to 2023.
Overall Percentage Growth:
Let’s calculate the overall percentage growth from 2014 to 2023 for key metrics:
- Sales Growth: Approximately 1520.23%
- Net Profit Growth: Approximately 137.42%
- EPS Growth: Approximately 135.27%
- Price Growth: Approximately 946.32%
Turnaround Factors:
The key turnaround factors for Godavari Drugs Ltd include consistent revenue and profit growth, effective cost management, and improved earnings per share. The dip in profitability in 2020 due to the pandemic was temporary, and the company rebounded in subsequent years.
Strong Factors:
- Consistent Revenue Growth: The company has demonstrated a strong track record of revenue growth over the years, indicating its ability to capture market share and expand its business.
- Profitability: Godavari Drugs Ltd has consistently improved its profitability, as evidenced by the rising operating profit and net profit margins.
- EPS Growth: Shareholders have benefited from increasing earnings per share, reflecting the company’s ability to generate value for investors.
Weak Factors:
- P/E Ratio Volatility: The fluctuating P/E ratio suggests that market sentiment can impact the stock’s valuation. Investors should be aware of this volatility.
Conclusion:
Based solely on the provided data, Godavari Drugs Ltd appears to be an attractive investment option. The company has shown consistent revenue and profit growth, effective cost management, and improved earnings per share. The overall percentage growth in key metrics is impressive, and the dip in profitability during the pandemic year seems to be a temporary setback.
However, investors should be cautious about the P/E ratio volatility, which suggests that market sentiment can affect the stock’s valuation. It’s essential to consider other factors, such as industry trends, competition, and macroeconomic conditions, before making an investment decision.
Investing in stocks carries inherent risks, and it’s advisable to conduct thorough research and consult with a financial advisor before making any investment decisions.
Combined technical and fundamental view
Financial Analysis:
- The company has shown consistent revenue and profit growth over the years.
- Effective cost management and improved earnings per share indicate financial stability and shareholder value.
- The overall percentage growth in key metrics is impressive, especially in sales, net profit, EPS, and stock price.
Technical Analysis:
- The stock price has seen significant growth over the years, with a breakout level of 102.
- Strong support is evident at the 70 level.
- The stock is currently trading near the upper channel, suggesting a potential breakout above 111.
Conclusion:
- Buy Level: A compelling buy level is around the 92-102 range, which corresponds to the breakout level.
- Target Level: Given the historical trends and technical breakout, a potential target range could be 158-200-300, with 158 as the initial target.
- Support Level: Strong support exists at 70, providing a safety net for investors.
In summary, based on the financial and technical analysis provided, Godavari Drugs Ltd appears to be a strong investment opportunity. However, as with any investment, there are inherent risks, and it’s crucial for investors to conduct further research, consider market conditions, and consult with a financial advisor before making investment decisions. The buy level, target level, and support level mentioned here are based on historical data and technical analysis but should be considered alongside other factors when making investment choices.