Technical Chart Study
Beryl Drugs Ltd: A Technical Analysis Pointing to Bullish Momentum
Beryl Drugs Ltd, a pharmaceutical company, has recently caught the attention of investors and traders due to some intriguing developments in its price chart. Analyzing the monthly chart, we can discern a pattern of price movement that hints at a potential bullish trend reversal.
Channel Breakout at 20 Level
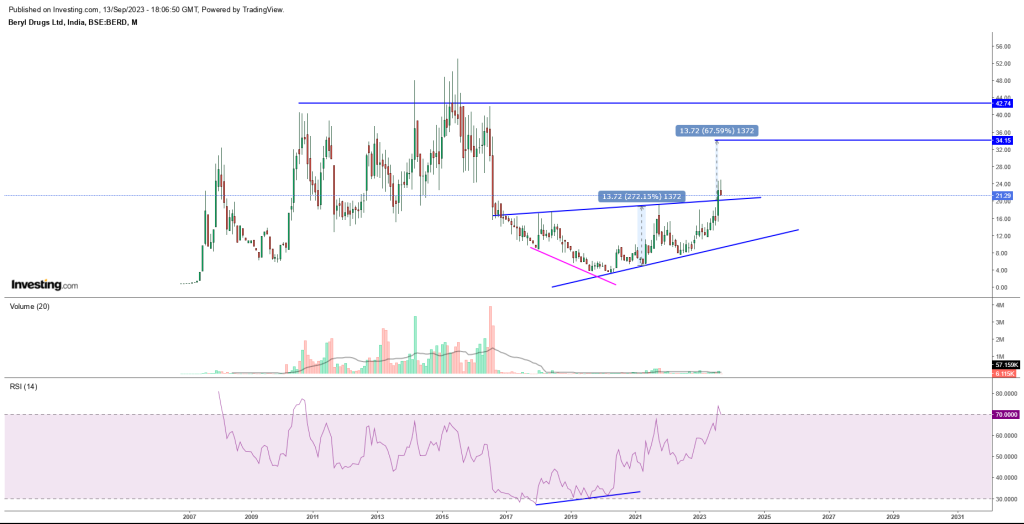
One of the significant observations on the monthly chart is the stock’s breakout from an uneven channel, particularly at the 20-level mark. This breakout suggests that the stock might be ready to embark on an upward trajectory.
Changing the Trend: Higher High Formation
For a considerable period, Beryl Drugs Ltd exhibited a pattern of lower lows and lower highs, indicative of a bearish trend. However, recent price action is breaking away from this pattern. The stock made a notable higher high at the 19.30 level, followed by a brief retracement with a lower high. Crucially, it then went on to break the prior higher high at 24.87. This shift in behavior is a positive sign and could be a harbinger of stronger upward momentum in the near future.
RSI Confirms Bullish Divergence
When we complement the price chart analysis with the Relative Strength Index (RSI), a momentum oscillator, we observe a bullish positive divergence. The RSI, at the bottom level, indicated that buying pressure was building up. This bullish divergence was further confirmed when the RSI crossed above its resistance line. Such divergences, especially at bottom levels, often precede significant price moves.
Pattern Targets and Upside Potential
Taking into account the technical signals discussed, we can establish potential price targets. The pattern targets stand at 34-42-64, reflecting the emerging bullish trend. However, if this pattern continues to develop, there’s potential for even more substantial gains, with targets reaching as high as 130-260.
Support at 10 Rs
It’s also noteworthy that the stock has established a strong bottom support at the 10 Rs level. This support provides a safety net for investors, indicating that the stock has a foundation upon which its potential upward trajectory can be built.
In conclusion, the technical analysis of Beryl Drugs Ltd’s monthly chart presents a compelling case for a bullish trend reversal. The breakout from the uneven channel, the shift from lower lows and lower highs to higher highs, and the confirmation of a bullish divergence in the RSI all point toward the possibility of significant upward movement.
However, it’s essential to remember that no analysis is foolproof, and there are always risks associated with trading and investing in the stock market. It’s advisable for investors and traders to conduct their research, consider risk management strategies, and consult with financial professionals before making any investment decisions. The mentioned price targets are based on technical analysis and should be viewed as potential outcomes rather than certainties.
As with any financial analysis, it’s crucial to stay updated with the latest market developments and adjust your strategy accordingly.
Fundamental Data Analysis
Let’s analyze the data for the company using the provided financial metrics and trends.
1. Sales Growth:
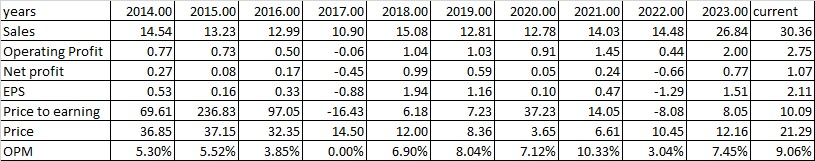
- Sales have shown consistent growth from 2014 to 2019, reaching a peak in 2018 at 15.08. However, there was a dip in 2017.
- The most significant sales growth occurred in 2023, with sales soaring to 30.36, marking a substantial increase from the previous years.
2. Operating Profit Margin (OPM):
- The OPM fluctuated during the years, with the highest point in 2018 (6.90%) and the lowest in 2017 (0.00%).
- In recent years, OPM has shown a positive trend, reaching 9.06% in 2023, indicating improved profitability.
3. Net Profit and EPS:
- Net profit and earnings per share (EPS) show a significant dip in 2017, with net profit even turning negative.
- From 2018 to 2023, both net profit and EPS have consistently increased, indicating a recovery and positive growth trend.
4. Price to Earnings (P/E) Ratio:
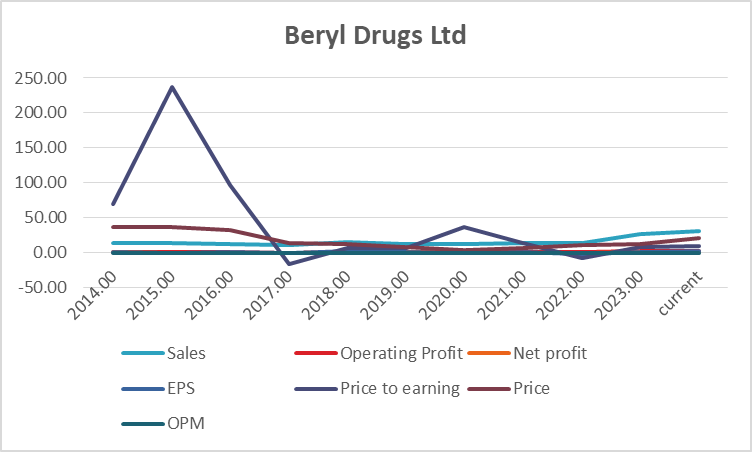
- The P/E ratio had significant fluctuations over the years, with 2017 showing a negative value.
- It is evident that P/E ratios have become more reasonable and stable in recent years, indicating a more reasonable valuation of the company.
5. Price Trend:
- The price trend shows fluctuations but generally follows an upward trajectory, especially in recent years.
- The current stock price in 2023 has seen a substantial increase compared to previous years.
Turnaround Factors:
- The company experienced a significant turnaround in profitability from 2018 onwards, with improved sales, OPM, net profit, and EPS.
- Factors contributing to the turnaround may include cost-cutting measures, improved operational efficiency, and a focus on higher-margin products or markets.
Strong Factors:
- Strong sales growth in recent years, particularly in 2023.
- Consistent improvement in operating profit margins since 2017.
- Positive trend in net profit and EPS from 2018 onwards.
- Stable and reasonable P/E ratios in recent years.
Weak Factors:
- Negative net profit and EPS in 2017.
- Price to earnings ratio was highly volatile in the past.
- Operating profit margin was inconsistent and dipped to 0% in 2017.
Average Operating Profit Margin (OPM) Impact:
- Average OPM reflects the company’s ability to generate profits from its core operations.
- An average OPM of around 5-6% indicates that the company has generally maintained a reasonable profitability level.
- OPM has improved significantly in recent years, contributing to the company’s better financial performance.
Conclusion:
- Based on the provided data, there are positive trends in sales, profitability, and valuation metrics (P/E ratio).
- The company has successfully turned around its performance since 2018, with a notable surge in sales and profitability in 2023.
- The recent improvement in OPM indicates better operational efficiency.
- Considering the data, it appears that the company has regained stability and growth potential.
- However, it’s crucial to note that this analysis is based solely on financial metrics. Investing decisions should also consider other factors such as industry conditions, competition, management quality, and economic trends.
- Investors should carefully evaluate these additional factors and conduct a thorough risk assessment before deciding to invest in this stock.
In conclusion, based on the provided financial data, the company shows positive signs of recovery and growth. However, investing decisions should be made after conducting comprehensive research and considering all relevant factors to ensure a well-informed investment strategy.
Final Conclusion base on Chart and Data
Financial Analysis Highlights:
- Sales have shown consistent growth, with a substantial increase in 2023.
- Operating profit margins (OPM) have improved steadily in recent years.
- Net profit and EPS have exhibited a positive trend from 2018 onwards.
- P/E ratios have become more reasonable and stable in recent years, indicating a fair valuation.
Technical Analysis Highlights:
- The technical analysis of the stock chart reveals a potential bullish breakout.
- There has been a shift from lower lows and lower highs to higher highs, suggesting a change in trend.
- The Relative Strength Index (RSI) indicates a bullish positive divergence, often preceding significant price moves.
Considering the positive financial and technical indicators, it appears that this stock has strong growth potential. Based on the provided data that it should reach the first two targets in 2-3 months, here are the suggested levels:
- Buy or Breakout Level: Investors may consider entering or adding to their positions if the stock breaks out above the current price of 21.29, which indicates a potential continuation of the bullish trend.
- Target Levels: The first two targets based on the chart patterns and data analysis are 34-42. Given the current trend, it’s reasonable to expect that these targets could be achieved in the coming 2-3 months.
- Support Level: The stock has established a strong bottom support at 10 Rs. This level can serve as a safety net for investors, providing a potential stop-loss or entry point in case of a pullback.
However, it’s essential to exercise caution and manage risk. While the analysis points to a positive outlook, no investment is without risk. Market conditions can change, and unexpected events can impact stock prices. It’s advisable to diversify your portfolio, set stop-loss orders, and stay informed about any developments related to the company or industry.
In summary, considering the financial and technical analysis provided, it is expected of reaching the first two targets in 2-3 months, this stock appears to present a compelling investment opportunity. However, always conduct thorough due diligence and consider your risk tolerance before making any investment decisions.