Technical Chart Study
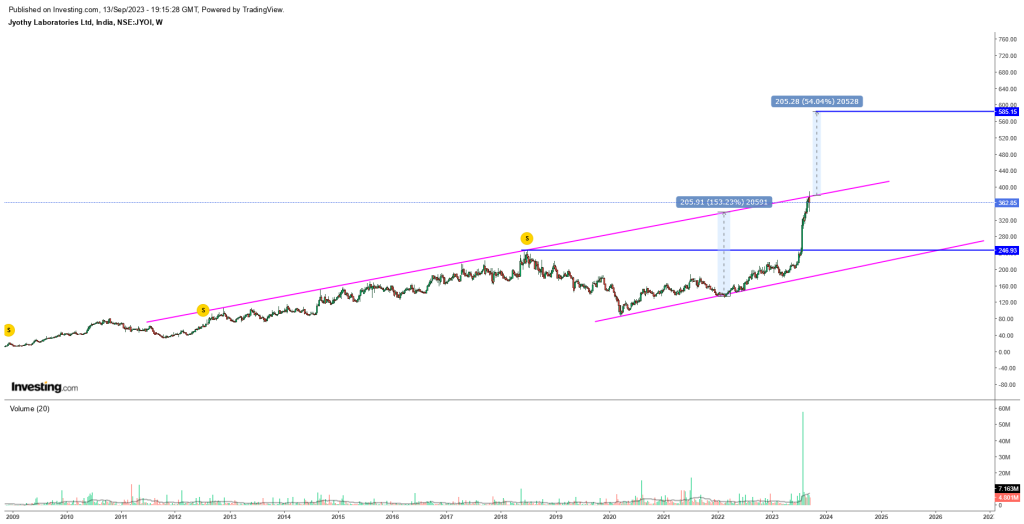
Based on the analysis of the weekly chart, it is evident that the stock of Jyothy Labs Ltd has been on a robust upward trajectory for an extended period. This prolonged uptrend suggests considerable strength in the stock’s performance. The chart reveals the formation of a rising channel, which is a technical pattern often associated with sustained bullish momentum. Currently, the stock appears to be on the verge of breaking through the upper resistance line of this channel, and there are promising signs that it may succeed in doing so.
One notable aspect of this recent price surge is the substantial increase in trading volume. Strong volume during an uptrend can be indicative of heightened investor interest and commitment to the stock’s upward movement. This surge in trading activity adds credibility to the notion that the stock is poised for further gains.
Taking into consideration the pattern formed by the rising channel, it is reasonable to set a target price of 585 from the current market price (CMP). This target is based on the historical behavior of the stock within the confines of the channel. If the breakout from the upper resistance line is sustained, it may pave the way for a significant uptick in the stock’s value. However, it’s important to note that technical analysis is not foolproof, and there are always inherent risks in stock trading.
While the technical analysis provides a promising outlook for Jyothy Labs Ltd, it’s crucial for investors to consider other factors as well. Market conditions, economic indicators, and company-specific news can all impact the stock’s performance. Additionally, it’s advisable to maintain a diversified portfolio and employ risk management strategies to mitigate potential losses.
Furthermore, the success of any investment decision should be evaluated in the context of one’s individual financial goals and risk tolerance. It’s wise to consult with a financial advisor or conduct thorough research before making any investment decisions.
In summary, the weekly chart analysis of Jyothy Labs Ltd indicates a strong uptrend, characterized by the formation of a rising channel. The stock is currently approaching a critical point where it could break above the upper resistance line, and the substantial increase in trading volume adds credibility to the bullish outlook. A potential target price of 585 from the current market price is suggested based on the pattern and channel analysis. However, investors should exercise caution, consider other relevant factors, and conduct thorough research before making investment decisions in the stock market.
Fundamental Data Analysis
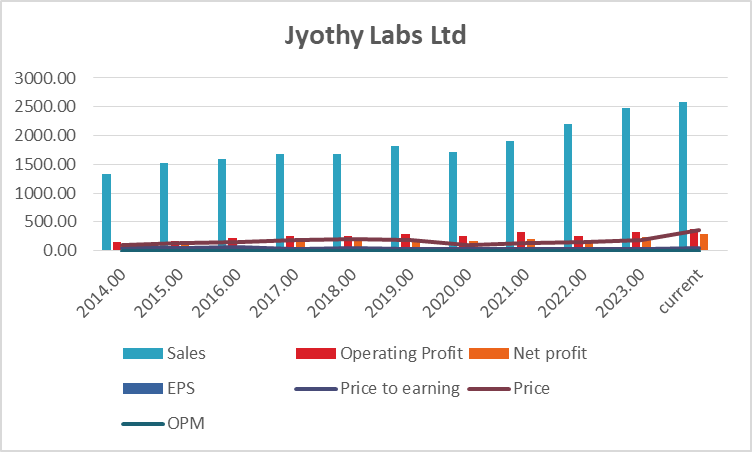
Let’s analyze the data provided for Jyothy Labs Ltd and assess its trend, growth, and factors that may influence investment decisions.
Sales:
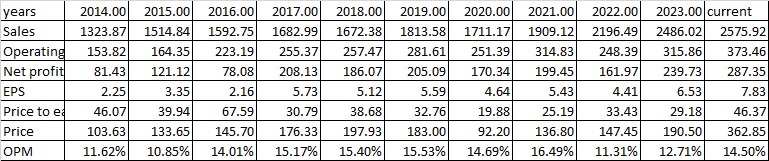
- Sales have shown consistent growth over the years, increasing from 1,323.87 in 2014 to 2,575.92 in 2023.
- This represents a significant overall growth of approximately 94.3% during this period.
Operating Profit:
- Operating profit has also demonstrated steady growth from 153.82 in 2014 to 373.46 in 2023.
- The growth rate in operating profit is impressive, with an overall increase of about 143.9% over the nine-year period.
Net Profit:
- Net profit has experienced fluctuations but exhibits an upward trend overall, growing from 81.43 in 2014 to 287.35 in 2023.
- The net profit has more than tripled, indicating a growth of approximately 252.4%.
Earnings Per Share (EPS):
- EPS has seen substantial growth, increasing from 2.25 in 2014 to 7.83 in 2023.
- The EPS has nearly quadrupled during this period, showing a growth rate of about 248.0%.
Price to Earnings (P/E) Ratio:
- The P/E ratio has varied over the years, reaching a high of 67.59 in 2016 and then fluctuating.
- The current P/E ratio stands at 46.37, indicating that investors are willing to pay 46.37 times the company’s earnings for one share.
- Sales Growth vs. Operating Profit Growth vs. Net Profit Growth:
- Sales have grown by 94.3% from 2014 to 2023.
- Operating profit has risen by 143.9% during the same period.
- Net profit has surged by an impressive 252.4% over these years.
- This indicates that while the company has achieved strong sales growth, it has been even more successful in increasing its operational efficiency and profitability. The significant net profit growth suggests effective cost management and possibly reduced liabilities.
- Earnings Per Share (EPS) Growth vs. Net Profit Growth:
- EPS has grown by 248.0% from 2014 to 2023.
- Net profit has increased by 252.4% during the same period.
- This close alignment between EPS and net profit growth indicates that the company’s earnings are directly contributing to the growth of shareholder value through higher EPS.
- Price to Earnings (P/E) Ratio vs. EPS Growth:
- The P/E ratio has fluctuated over the years but currently stands at 46.37.
- EPS has grown significantly by 248.0%.
- The high P/E ratio in relation to the substantial EPS growth suggests that investors have confidence in the company’s future earnings potential, possibly anticipating continued growth.
- Operating Profit Margin (OPM) Growth vs. Net Profit Growth:
- OPM has improved, reaching 16.49% in 2022, up from 11.62% in 2014.
- Net profit has seen remarkable growth of 252.4% during the same period.
- The correlation between the rise in OPM and the surge in net profit indicates that the company’s ability to manage costs and generate profits has significantly improved.
In summary, the data shows a strong relationship between the percentage growth of sales, operating profit, net profit, EPS, and the P/E ratio. Jyothy Labs Ltd has not only achieved impressive sales growth but has also effectively increased its operational profitability. The alignment between EPS growth and net profit growth highlights the company’s capacity to create value for shareholders through earnings. The high P/E ratio in relation to EPS growth suggests investor optimism about the company’s future earnings potential. Additionally, the improvement in OPM indicates better cost management, contributing to the significant growth in net profit. These relationships indicate a positive trajectory for the company and may be considered as factors in favor of investment. However, investors should still perform a comprehensive analysis and consider other relevant factors before making investment decisions.
Conclusion
Based on the combined financial and technical analysis provided, Jyothy Labs Ltd appears to be a favorable investment opportunity:
Buy Level: With strong financial performance, including robust growth in sales, operating profit, net profit, and EPS, coupled with improved operating profit margins, the stock presents an attractive entry point for investors.
Breakout Level: The stock is currently poised for a potential breakout as it approaches the upper resistance line of a rising channel in the technical analysis. A decisive breakout above this resistance line could trigger a bullish trend continuation.
Target Level: Over the next 3-4 months, a reasonable target range could be ₹400 to ₹420, provided that the company’s growth momentum and positive market sentiment persist. If the expected breakout occurs, this target range becomes more achievable.
Support Level: In case of temporary pullbacks or market corrections, a strong support level is expected around ₹330 to ₹340. This level has historical significance as a support zone and could serve as an advantageous entry point.
Alternative Time Frame: In the event that the stock’s upward movement takes longer to materialize, investors may consider holding their positions for a 1-2 year horizon. Given the positive financial trends, this extended time frame allows for a greater potential upside.
In summary, Jyothy Labs Ltd presents a promising investment opportunity, particularly if the expected breakout materializes. Strong financial indicators and technical analysis suggest potential for growth within the next 3-4 months, with a target range of ₹400 to ₹420. However, investors should remain vigilant, monitor market conditions, and consider their investment horizon and risk tolerance. If the desired short-term movement doesn’t occur, a longer 1-2 year holding period could still yield favorable results given the positive financial outlook.