About Company
Plastic packaging has long been associated with environmental concerns due to its persistence in landfills and its impact on marine life. However, TPL Plastech Ltd has emerged as a trailblazer in the plastic industry by redefining packaging with a strong commitment to sustainability and eco-friendliness.
TPL Plastech Ltd is an Indian-based company that specializes in manufacturing various plastic products, with a particular focus on packaging solutions. What sets this company apart from many others in the industry is its unwavering dedication to green initiatives and the implementation of sustainable practices throughout its operations.
1. Sustainable Materials and Technologies
TPL Plastech has embarked on a journey to revolutionize plastic packaging by introducing sustainable materials and cutting-edge technologies. They have embraced bioplastics, a category of plastics derived from renewable sources such as corn starch, sugarcane, and potato starch. These bioplastics have a significantly lower carbon footprint compared to traditional plastics made from fossil fuels. Moreover, TPL Plastech is actively researching and investing in innovative materials and technologies to make their products even more environmentally friendly.
2. Recyclability and Circular Economy
One of TPL Plastech’s core principles is to promote a circular economy for plastic products. The company is taking strides to ensure that their packaging materials are not only recyclable but are also designed with recyclability in mind. They work closely with recycling facilities to develop packaging that can be easily integrated back into the production process, thus reducing the need for new raw materials and minimizing waste.
3. Reduced Environmental Impact
TPL Plastech Ltd is keen on minimizing its environmental impact at all levels of production. They have invested in state-of-the-art manufacturing facilities that are energy-efficient and have reduced water consumption. The company is also committed to minimizing greenhouse gas emissions, and they regularly assess their carbon footprint to identify areas for improvement.
4. Eco-Friendly Product Range
The company’s product range is a testament to its green initiatives. TPL Plastech offers a variety of eco-friendly packaging solutions, including biodegradable bags, compostable containers, and recyclable bottles. These products not only cater to the growing demand for sustainable packaging but also align with the company’s vision of reducing the environmental burden of plastic waste.
5. Collaboration and Certification
TPL Plastech understands that sustainability cannot be achieved in isolation. The company actively collaborates with environmental organizations, industry associations, and government bodies to stay informed about the latest eco-friendly practices and regulations. They also seek certifications such as ISO 14001 (Environmental Management System) and FSSC 22000 (Food Safety System Certification) to maintain high standards of sustainability and quality.
6. Corporate Responsibility
Corporate social responsibility is integral to TPL Plastech’s business philosophy. They engage in various community and environmental initiatives to give back to society and protect the planet. From organizing tree planting drives to supporting local schools and healthcare centers, the company is committed to making a positive impact beyond its core business activities.
TPL Plastech’s green initiatives have not only redefined plastic packaging but have also set a shining example for the industry. Their dedication to sustainability, the use of innovative materials, and a strong commitment to eco-friendly practices have made them a beacon of hope in an industry often criticized for its environmental impact.
In conclusion, TPL Plastech Ltd is not just a plastic packaging company; it is a forward-thinking organization that is actively reshaping the industry in a sustainable and responsible way. By embracing green initiatives, investing in innovative technologies, and prioritizing recyclability, TPL Plastech is leading the charge in redefining the future of plastic packaging.
Technical Chart Analysis
Analyzing Chart Patterns: TPL Plastech’s Potential Breakouts
When it comes to technical analysis, chart patterns often play a pivotal role in predicting a stock’s future price movement. TPL Plastech Ltd’s chart is no exception, revealing multiple pattern breakouts that could influence its trajectory. Let’s dissect these patterns one by one.
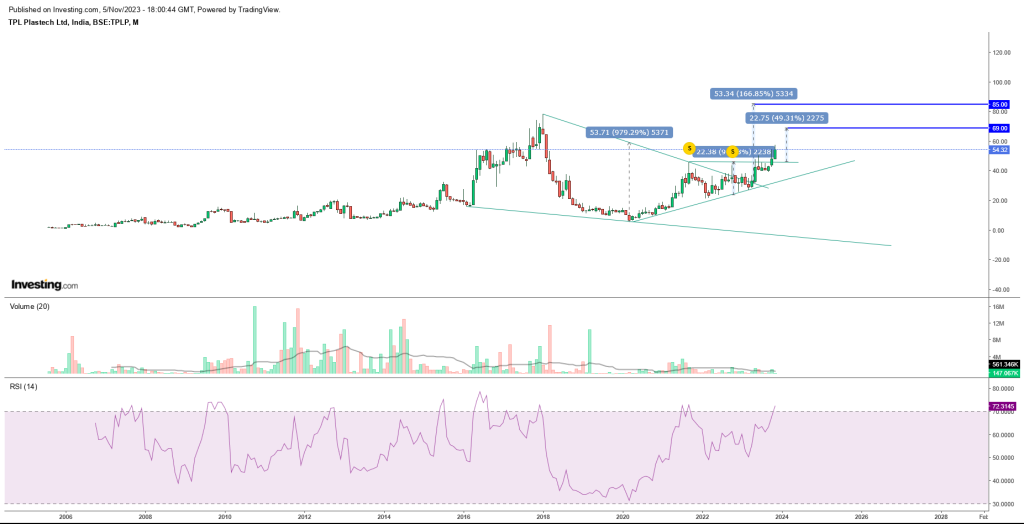
1. Falling Wedge Breakout:
On a larger time frame, we can discern a prominent falling wedge pattern. The stock successfully broke out above the 46-level, which is a critical point for this pattern. According to this breakout, the stock has the potential to ascend to around 85.
2. Ascending Triangle Breakout:
Interestingly, an ascending triangle breakout occurred at the same level, 46. As per this pattern, the stock is expected to make a significant move, possibly reaching 69.
3. RSI Divergence:
Furthermore, the Relative Strength Index (RSI) paints a bullish picture. It exhibits a positive divergence, where the stock’s price is making higher highs while the RSI is still forming lower highs. This divergence suggests growing momentum in favor of the stock.
The culmination of these patterns and the RSI divergence reinforces the potential for a robust price surge. The stock has convincingly broken through the 46 Rs. resistance level, and as per these patterns, it has set its sights on targets ranging from 69 to 85.
Additionally, it’s worth noting that the recent bottom at 38 Rs. can serve as a strong support level for these patterns, providing a safety net for potential pullbacks.
In conclusion, the technical analysis of TPL Plastech Ltd’s chart indicates several pattern breakouts that suggest a bright future for the stock. The falling wedge and ascending triangle patterns, along with the RSI divergence, provide a compelling case for a price surge. With a clear breakout above 46 Rs., the stock appears poised to aim for the targets of 69 to 85 Rs. These patterns, combined with a robust support level at 38 Rs., make for an exciting prospect for investors looking to capitalize on potential price movements. However, always remember that while technical analysis provides valuable insights, it should be used in conjunction with other forms of analysis and risk management.
Fundamental Data Analysis
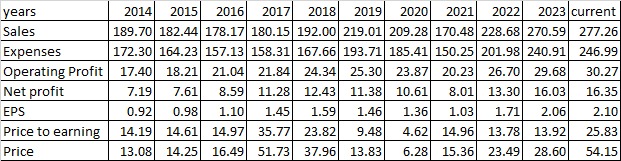
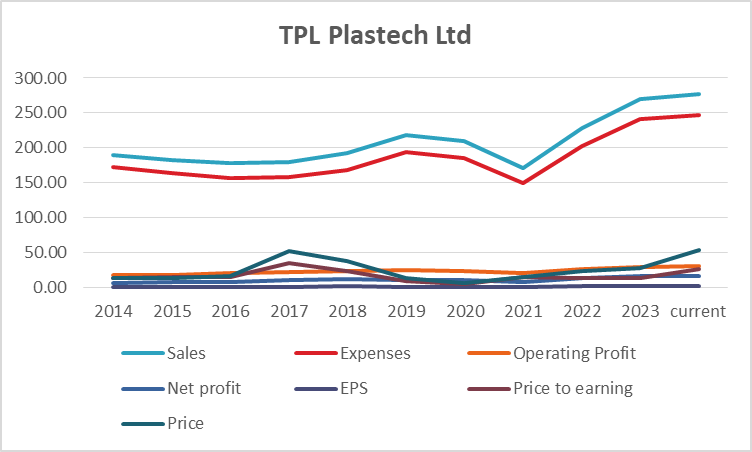
Analyzing the provided financial data for the years 2014 to the current year 2023, we can observe various trends and factors that impact the company’s financial performance. Please note that this analysis is based solely on the financial figures provided and does not take into account external factors or qualitative aspects.
Revenue Trends:
- Sales have seen a consistent upward trend, with a steady increase from 189.70 in 2014 to 277.26 in 2023, representing an overall growth of approximately 46.1%.
Expense Trends:
- Expenses have also risen over the years but at a slower pace compared to sales. While there have been fluctuations, the company has managed to control its expenses, resulting in a manageable cost structure.
Operating Profit and Net Profit Trends:
- Operating profit and net profit have generally increased over the years. The company has been able to maintain healthy profit margins, indicating efficient operations and profitability.
Earnings per Share (EPS) Trends:
- The EPS has shown a positive trend, reflecting the company’s ability to generate earnings for its shareholders. It has grown from 0.92 in 2014 to 2.10 in 2023, marking substantial growth.
Price-to-Earnings (P/E) Ratio Trends:
- The P/E ratio has experienced fluctuations. It was particularly high in 2017 and 2018, indicating a surge in investor expectations. However, it has stabilized in recent years, remaining around 13.92 in 2023.
Stock Price Trends:
- The stock price has exhibited significant volatility, reaching its peak in 2018 and declining sharply in the subsequent years. It has since shown a steady recovery and currently stands at 54.15.
Turnaround Factors:
- Revenue Growth: The consistent increase in sales reflects the company’s ability to expand its top line over the years.
- Profitability: Operating and net profits have shown improvement, indicating effective cost management and revenue growth.
- EPS Growth: A rising EPS demonstrates the company’s capacity to generate more earnings per share for its investors.
Strong Factors:
- Profit Margins: The company has maintained healthy profit margins, showcasing operational efficiency.
- Revenue Growth: The consistent sales growth indicates market demand and potential for the company’s products.
- EPS Growth: The increase in EPS suggests a positive outlook for shareholders.
Weak Factors:
- Stock Price Volatility: The stock price has exhibited significant fluctuations, which might deter risk-averse investors.
- High P/E Ratio in 2017 and 2018: The exceptionally high P/E ratio in those years might have created unrealistic investor expectations.
Conclusion: Based on the provided financial data, it appears that the company has experienced a turnaround in its financial performance. Strong factors include consistent revenue and profit growth, solid profit margins, and rising EPS. However, the stock price has been highly volatile, and the P/E ratio experienced a spike in 2017 and 2018, which may be a cause for concern.
Investing in this stock would require a careful assessment of risk tolerance and a long-term perspective. The data suggests that the company has the potential for growth, but it has also experienced significant fluctuations in the past. Investors should consider diversifying their portfolios and conducting further research into the company’s industry and competitive position before making an investment decision.
Final conclusion based on technical analysis and fundamental data
Financial Analysis:
- The company has demonstrated consistent revenue and profit growth over the years, reflecting strong operational performance.
- Profit margins have remained healthy, indicating efficient cost management.
- Earnings per share (EPS) has shown positive growth, implying the company’s ability to generate earnings for shareholders.
- The stock price has exhibited significant volatility, with a notable peak in 2018 followed by a sharp decline and a subsequent recovery.
Technical Analysis:
- The stock price has experienced multiple pattern breakouts, indicating the potential for significant price movements.
- Key technical levels to consider:
- Breakout Level: 46 Rs.
- Potential Target Levels: 69 Rs. and 85 Rs.
- Recent Support Level: 38 Rs.
Considering the financial and technical analysis, the stock appears to have strong fundamentals with consistent revenue and profit growth, efficient cost management, and rising EPS. The technical analysis suggests that the stock has the potential for a significant price increase after breaking out at 46 Rs.
Buy Recommendation:
- Based on the data provided, it appears to be a favorable time to consider a buy position, especially for those with a higher risk tolerance and a long-term investment horizon.
- The breakout level at 46 Rs. serves as an entry point for potential investors.
Target Levels:
- The technical analysis indicates potential target levels of 69 Rs. and 85 Rs., which could be considered as profit-taking points.
Support Level:
- The recent support level at 38 Rs. can act as a safety net for potential pullbacks, offering a level of downside protection.
Caution:
- The stock has exhibited significant price volatility in the past, which could present risks to investors.
- Investors should conduct additional research, consider diversification, and stay informed about the company’s industry and competitive position before making an investment decision.
In conclusion, the combination of strong fundamental data and promising technical analysis suggests that the stock may be a good buy at the breakout level of 46 Rs., with potential target levels of 69 Rs. and 85 Rs. However, due to historical volatility, caution is advised, and it is essential to carefully assess your risk tolerance and investment objectives before making a decision.