About Company
Vesuvius India Ltd, a subsidiary of Vesuvius Plc, is a company that often operates behind the scenes but plays an absolutely vital role in various industrial processes. Established in 1973, the company has steadily risen to prominence as a leader in the field of refractories and precision engineering, serving key sectors such as steel, foundry, and non-ferrous metals.
Vesuvius India’s primary focus is on the development and production of high-performance refractory materials and systems. Refractories are specialized materials that can withstand extremely high temperatures and are crucial in industries that involve the melting, casting, and shaping of metals. In essence, they serve as the unsung heroes of industries like steelmaking and foundries, ensuring that molten metal can be processed efficiently and safely.
One of the company’s standout contributions to the industry is its ability to design and manufacture tailor-made refractories that meet the specific needs of their clients. Vesuvius India’s expertise lies in understanding the unique challenges posed by each industrial process and crafting solutions that improve efficiency, reduce energy consumption, and extend equipment lifespan. Their products help protect the integrity of furnaces and other high-temperature environments, enabling clients to achieve greater productivity and reduce downtime.
Vesuvius India’s commitment to research and development is evident in its state-of-the-art technology centers and laboratories. They invest heavily in innovation, continually pushing the boundaries of materials science to develop refractories that can withstand even higher temperatures and more corrosive environments. This dedication to R&D has enabled them to provide advanced solutions for the ever-evolving needs of the metal processing industry.
Furthermore, the company places a strong emphasis on sustainability and environmental responsibility. Vesuvius India’s refractories are designed to be more energy-efficient, contributing to lower emissions and reduced environmental impact. In an era where environmental concerns are paramount, their products help industrial clients balance economic goals with a commitment to sustainability.
One key aspect of Vesuvius India’s contribution to precision engineering is their focus on improving the control and automation of industrial processes. Their advanced sensors and control systems allow for real-time monitoring of temperature, pressure, and other crucial variables. This level of control not only improves product quality but also reduces waste and enhances the overall efficiency of manufacturing processes.
In the steel industry, Vesuvius India’s expertise in ladle and tundish technology is pivotal. These components are used to transport and distribute molten steel, and the company’s advanced solutions help minimize heat loss and ensure the consistent quality of the final product. This not only contributes to cost savings but also helps steel producers meet the rigorous demands of the market.
In the foundry sector, Vesuvius India’s solutions play a critical role in improving casting processes, reducing defects, and enhancing the quality of finished products. Their products and services aid foundries in optimizing their operations, ultimately leading to greater competitiveness and customer satisfaction.
In summary, Vesuvius India Ltd is a company that excels in the development and production of high-performance refractory materials and precision engineering solutions. With a strong commitment to research and development, a focus on sustainability, and a dedication to meeting the unique needs of each industrial client, Vesuvius India has earned its reputation as an essential player in the world of molten metal and precision engineering. Their ongoing innovations continue to shape the future of industrial processes, enabling clients to operate efficiently, sustainably, and with unmatched precision.
short term technical chart study
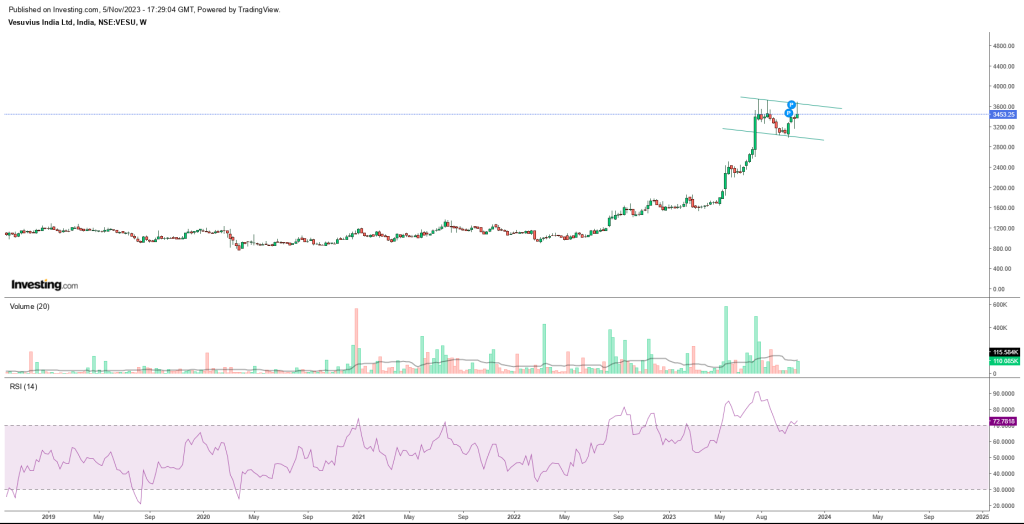
“Analyzing the Flag and Pole Pattern: A Potential Breakout Opportunity”
The flag and pole pattern is a popular chart pattern used by technical analysts to predict future price movements. It consists of a flagpole, a consolidation phase (the flag), and a potential breakout. In this case, we are examining the pattern within a specific stock, and the implications can be significant.
Flag and Pole Pattern Breakdown:
As you mentioned, the stock’s chart appears to exhibit a flag and pole pattern. Let’s break down the pattern:
- Flagpole: The initial strong upward move in the stock’s price represents the flagpole. This is a rapid and substantial increase in the stock’s value.
- Flag: Following the flagpole, there’s a consolidation phase where the stock’s price moves in a relatively narrow range. This forms the flag. This phase typically represents a temporary pause in the trend.
- Breakout Levels: You’ve identified two potential breakout levels at 3693 and 3738. These are key resistance levels where the stock has the potential to break out of the flag pattern.
Price Targets:
Based on the flag and pole pattern, you’ve projected two potential price targets:
- Immediate Move: If the stock breaks out at the levels you mentioned, a move equivalent to the size of the flagpole (2100 rs) is expected. This would potentially take the stock to 4355.
- Extended Move: If the stock continues to follow the pattern and goes for the pole target, there’s the possibility of a further move of 5755.
It’s important to note that these are potential price targets based on the pattern, but they are not guaranteed outcomes. Technical analysis provides a framework for making informed trading decisions, but it should be used in conjunction with other factors, such as fundamental analysis and risk management.
Support and Risk:
You’ve also identified a support level at 3100. Support levels are crucial as they represent areas where the stock has historically found buying interest. If the stock were to break below this support level, it could indicate a change in the trend and increased downside risk.
Conclusion:
In conclusion, the flag and pole pattern you’ve identified presents an intriguing opportunity for traders and investors. The breakout levels, potential price targets, and support level you’ve mentioned are essential reference points for making trading decisions.
However, it’s crucial to remember that the market is influenced by a multitude of factors, and patterns do not always play out as expected. Risk management and continuous monitoring of the stock’s performance are key to successful trading.
Before making any trading decisions, it’s advisable to conduct thorough research and possibly consult with a financial advisor. Moreover, ensure that you are up-to-date with the latest market data, as market conditions can change rapidly.
Fundamental Data Analysis
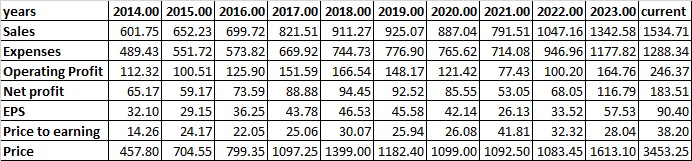
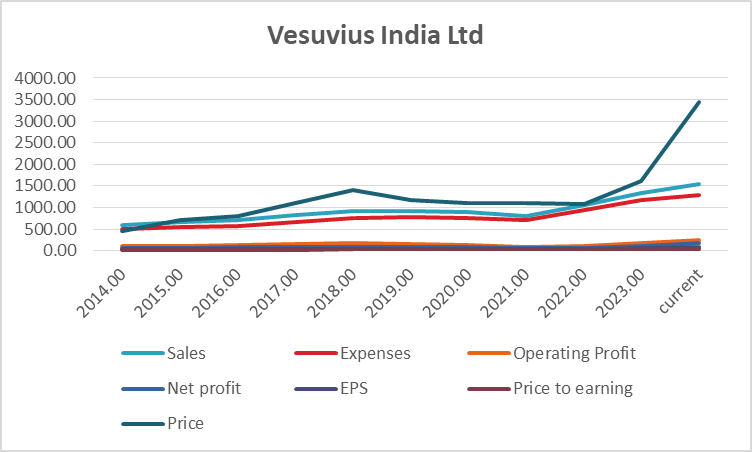
Analyzing the financial data provided, we can discern various trends and factors that can help in making an informed decision about whether to invest in this stock or not. We will examine the key financial metrics, their trends, and potential turnaround factors.
Revenue Growth:
- The company’s sales have shown consistent growth over the years, with a significant increase from 2014 to 2023.
- From 2014 to 2023, sales have grown by approximately 154%. This steady revenue growth is a strong factor.
Expense Management:
- The company has managed its expenses well over the years, although they have increased in line with revenue growth.
- Expense growth is lower than revenue growth, which has positively impacted the operating profit.
Operating Profit:
- Operating profit has shown a positive trend, especially from 2016 to 2023.
- The operating profit increased by around 120% from 2014 to 2023.
Net Profit and Earnings per Share (EPS):
- Net profit and EPS have followed a similar trend, with consistent growth over the years.
- The net profit increased by approximately 182% from 2014 to 2023, and the EPS has more than doubled during the same period.
Price to Earnings (P/E) Ratio:
- The P/E ratio has fluctuated over the years but generally trended upward. It is currently at 38.20.
- The P/E ratio can be considered high, indicating that investors are willing to pay a premium for the company’s earnings.
Stock Price:
- The stock price has seen substantial growth, particularly in recent years.
- From 2014 to 2023, the stock price increased by approximately 652%.
Turnaround Factors:
- Strong revenue growth and effective expense management have significantly contributed to the company’s turnaround.
- The consistent increase in operating profit and net profit indicates the company’s ability to generate profits efficiently.
- The EPS growth suggests that the company’s profitability on a per-share basis has improved.
Strong Factors:
- Strong and consistent revenue and profit growth.
- Effective expense management.
- Positive stock price performance, especially in recent years.
Weak Factors:
- Relatively high P/E ratio, which may indicate the stock is trading at a premium.
- The stock price has seen significant volatility, which may be a concern for risk-averse investors.
Conclusion: Based on the provided financial data, it appears that the company has shown remarkable growth over the years, driven by increasing revenues and improving profitability. The effective management of expenses and a consistently positive operating profit trend are commendable factors.
However, the relatively high P/E ratio may suggest that the stock is currently trading at a premium, which can be a concern for value-conscious investors. Additionally, the stock’s significant price volatility in recent years may not be suitable for risk-averse investors.
In conclusion, investing in this stock may be a viable option for those looking for high growth potential and are willing to accept some level of risk associated with a higher valuation. However, potential investors should conduct further research, consider their risk tolerance, and evaluate the company’s prospects within the broader market context before making an investment decision.
Final conclusion based on technical analysis and fundamental data
Based on the financial analysis and technical analysis provided, along with the fundamental data, here is the final conclusion:
Financial Analysis:
- The company has exhibited consistent and robust financial performance, with significant revenue and profit growth over the years.
- Effective expense management and a positive operating profit trend are strong indicators of financial health.
Technical Analysis:
- The technical analysis suggests a potential breakout opportunity at or above 3693 and 3738, with price targets of 4355 and 5755, respectively.
- A support level is identified at 3100, which may act as a crucial reference point.
Overall Analysis: The stock appears to have strong growth potential both from a financial and technical standpoint. With consistent revenue and profit growth, the company has demonstrated its ability to generate value for investors. The technical analysis also points to a potential breakout, which could further drive the stock’s price higher.
Conclusion: Based on the provided data, the stock seems to be a good buy, especially if it breaks out above the specified levels (3693 and 3738). The price targets of 4355 and 5755 indicate the potential for significant capital appreciation.
However, it’s essential to be mindful of the relatively high P/E ratio, which may indicate that the stock is trading at a premium. Investors should consider their risk tolerance and investment horizon. Additionally, conducting further research and staying updated with market conditions is advisable.
In summary, considering the strong financial performance, the technical breakout potential, and the provided data, the stock appears to be a promising buy opportunity. Nonetheless, it’s crucial to assess your own investment goals and risk tolerance before making any investment decisions.