Technical Analysis: Ajcon Global Services Ltd Shows Promising Breakouts on Weekly Chart
Ajcon Global Services Ltd has recently caught the attention of technical analysts, as the weekly chart reveals compelling breakout patterns that could signify a significant shift in the stock’s trajectory. Let’s delve into the details of the key patterns observed and their potential implications for investors.
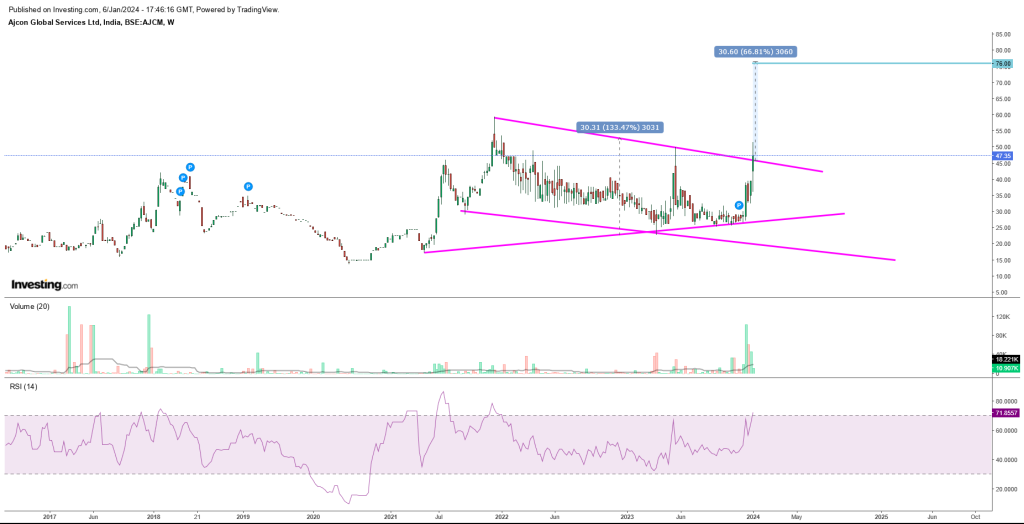
Symmetrical Triangle Breakout: The weekly chart prominently displays the formation of a symmetrical triangle pattern. This pattern is characterized by converging trendlines, indicating a period of consolidation before a potential breakout. In the current week, Ajcon Global has successfully breached the upper trendline of the symmetrical triangle with a convincing close above it. What adds weight to this breakout is the surge in trading volume during this move.
The heightened volume is a crucial indicator, suggesting strong market participation and validating the breakout. The influx of strong investor interest is a positive sign, as it implies a broader market consensus supporting the stock’s upward movement. The breakthrough above the resistance level signals a potential bullish trend reversal.
Target Analysis: Analyzing the symmetrical triangle’s range, we can project an upper target range for Ajcon Global Services Ltd. Based on the pattern’s characteristics, a target range of 75-76 levels is plausible. This projection is derived by measuring the height of the triangle at its widest point and adding it to the breakout level. Investors and traders could use this target range to set profit objectives and manage their positions accordingly.
Falling Channel Breakout: In addition to the symmetrical triangle breakout, a falling channel pattern is also evident on the weekly chart. Falling channels typically represent a downtrend, and a breakout above the upper boundary suggests a potential reversal. Ajcon Global has achieved precisely that, closing above the resistance point of the falling channel in the current week.
This breakout is noteworthy as it complements the symmetrical triangle breakout, providing additional confirmation of the stock’s upward momentum. The fact that this breakout occurred on a weekly timeframe adds further significance, implying a more sustained and robust shift in the prevailing trend.
Key Levels and Support: For traders and investors looking to navigate this potential bullish trend, it’s essential to identify key levels. The breakout at 45 levels and the subsequent breach of the current candle’s top point at 51.40 are crucial milestones. A successful continuation past these levels would confirm the validity of the patterns and signal further upside potential.
In terms of support, the chart indicates a strong foundation around the 30 level. This support level is vital for the integrity of the bullish scenario. A failure to hold above this level could cast doubt on the sustainability of the breakout.
Conclusion: Ajcon Global Services Ltd’s weekly chart paints a promising picture for those eyeing potential bullish opportunities. The combination of symmetrical triangle and falling channel breakouts, supported by strong volume and key resistance breaches, suggests a favorable risk-reward profile. Traders and investors should monitor key levels closely and consider the projected target range of 75-76 levels. As always, prudent risk management strategies should be employed to navigate the inherent uncertainties of the market.
In summary, Ajcon Global Services Ltd appears to be charting a new course, and investors would do well to keep a close eye on this evolving technical landscape.
About company
Ajcon Global Services Ltd: Navigating Financial Excellence
Ajcon Global Services Ltd stands as a prominent player in the financial services sector, offering a comprehensive range of investment advisory and financial management services. Established with a vision to provide innovative and client-centric solutions, the company has consistently demonstrated a commitment to financial excellence and strategic foresight.
Company Overview: Ajcon Global Services Ltd is an India-based financial services company that operates in various segments of the financial industry. Established with a vision to provide comprehensive financial solutions, the company has carved a niche for itself in the competitive financial services landscape.
Business Segments: The company’s core business segments include investment advisory, wealth management, and financial consultancy. Ajcon Global is recognized for its ability to tailor financial strategies to meet the unique needs of its clients, whether they are individuals, institutions, or corporate entities.
Investment Advisory: Ajcon Global Services is renowned for its robust investment advisory services. The company leverages its market insights, research capabilities, and a team of seasoned financial experts to offer clients well-informed investment guidance. This encompasses advising on equities, commodities, currencies, and other financial instruments. The company’s commitment to staying abreast of market trends and economic developments positions it as a trusted partner for those seeking strategic investment advice.
Wealth Management: Wealth management is a critical facet of Ajcon Global’s offerings. The company recognizes that wealth creation is a multifaceted endeavor that goes beyond traditional investment advice. Ajcon Global endeavors to provide holistic wealth management solutions, considering factors such as risk tolerance, financial goals, and market dynamics. By offering a suite of wealth management services, the company aims to assist clients in preserving and growing their financial assets.
Financial Consultancy: Ajcon Global Services Ltd also provides financial consultancy services, catering to the diverse financial needs of its clientele. This includes financial planning, risk management, and strategic financial advisory services for businesses. The consultancy arm of the company plays a pivotal role in helping clients navigate complex financial landscapes and make informed decisions.
Market Presence: The company’s presence in the financial markets is underscored by its commitment to professionalism, integrity, and client-centricity. Over the years, Ajcon Global has built a strong reputation for delivering value to its clients and adapting to the dynamic nature of financial markets.
Technology and Innovation: In an era where technology plays a crucial role in financial services, Ajcon Global has likely embraced innovative solutions to enhance its service delivery. Whether it’s leveraging data analytics for market insights or implementing technology-driven platforms for client interactions, staying technologically adept is vital in the financial services industry.
Corporate Governance and Compliance: For companies operating in the financial sector, adherence to corporate governance and regulatory compliance is paramount. Ajcon Global Services Ltd is expected to uphold high standards in these areas to ensure transparency, accountability, and regulatory adherence.
In conclusion, Ajcon Global Services Ltd stands out as a comprehensive financial services provider, offering a spectrum of solutions to meet the diverse needs of its clientele. Its commitment to excellence, seasoned professionals, and adaptability to market dynamics position it as a key player in India’s financial services landscape. As with any investment, potential stakeholders are advised to conduct thorough due diligence, taking into account the latest financial reports and market conditions.
Fundamental Data analysis
Data Analysis:
- Sales Trend:
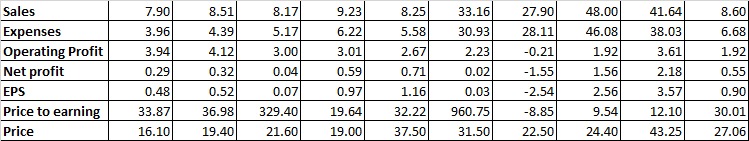
- The sales figures show fluctuations over the years, with a significant jump in 2019, reaching a peak of 33.16. However, 2020 saw a decrease, followed by a recovery in 2021 and a subsequent decline in 2022 and 2023.
- Expense Management:
- Expenses have generally followed the trend of increasing sales, indicating a proportionate rise in operational costs. The company managed to control expenses in 2020 and 2021, contributing to higher operating profits.
- Operating Profit:
- Operating profit has seen variations, reaching a low in 2020 with a negative value. There was a recovery in 2021, but the subsequent years show fluctuations, with 2023 returning to a positive operating profit.
- Net Profit and EPS:
- Net profit and EPS follow a similar pattern, peaking in 2021. However, 2020 shows a significant dip in both figures, with net profit even turning negative. The subsequent years see a recovery but not to the levels witnessed in 2021.
- Price to Earnings Ratio (P/E):
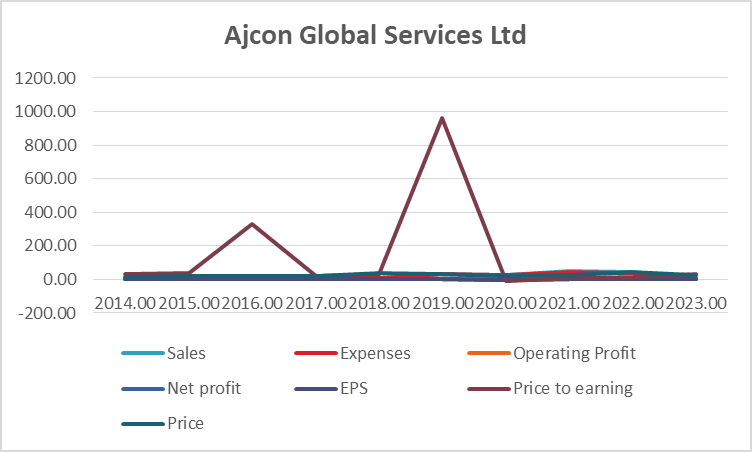
- The P/E ratio fluctuates widely, with extreme values in 2016, 2019, and 2020. The negative P/E in 2020 suggests an accounting loss. The ratio stabilizes in the following years, indicating potential market confidence.
- Stock Price:
- The stock price shows volatility, particularly in 2018 and 2019. There’s a significant jump in 2020, followed by fluctuations in the subsequent years.
Overall Percentage Growth:
- Sales: The overall percentage growth from 2014 to 2023 is positive, with a notable surge in 2019.
- Expenses: The expenses have grown in tandem with sales, contributing to operational costs.
- Operating Profit: While there are fluctuations, there’s a recovery in operating profit from negative values in 2020.
- Net Profit and EPS: The overall percentage growth in net profit and EPS is positive, with a peak in 2021.
- Stock Price: The stock price has seen fluctuations, with a significant increase in 2020.
Turnaround Factors:
- Expense Management in 2020 and 2021: The company exhibited effective cost control in 2020 and 2021, contributing to improved profitability.
- Recovery in Operating Profit in 2021: After a negative operating profit in 2020, the company rebounded with a positive figure in 2021.
- Sales Growth in 2019: A substantial increase in sales in 2019 contributed to improved financial performance.
Strong Factors:
- Positive Net Profit and EPS: The company has consistently generated positive net profits and earnings per share, with a notable peak in 2021.
- Stable P/E Ratio Post-2020: The P/E ratio stabilizes after the extreme fluctuations in 2019 and 2020, indicating potential market confidence.
Weak Factors:
- Fluctuating Sales and Profitability: The company has experienced fluctuations in sales and profitability, indicating potential challenges in maintaining consistent performance.
- Volatility in Stock Price: The stock price has shown volatility, which might be a concern for risk-averse investors.
Conclusion: Ajcon Global Services Ltd exhibits a mix of positive and challenging indicators. The positive factors include consistent positive net profits, improved expense management in certain years, and a stabilized P/E ratio post-2020. However, the company faces challenges such as fluctuating sales, varying profitability, and stock price volatility.
Investors should carefully consider the company’s performance trends, taking note of the turnaround factors and potential risks. While the positive aspects suggest a level of resilience, the fluctuations in sales and stock price could pose challenges. It is advisable for investors to conduct further research, considering additional factors beyond the financial data provided, before making investment decisions.
Final Outlook
Conclusion:
Ajcon Global Services Ltd presents a mixed picture based on both financial and technical analyses. While there are positive indicators such as consistent positive net profits, improved expense management in certain years, and a stabilized P/E ratio post-2020, the company faces challenges, including fluctuating sales, varying profitability, and stock price volatility.
Financial Analysis:
- Positive Aspects:
- Consistently positive net profits and earnings per share.
- Effective expense management in certain years.
- Stabilized P/E ratio post-2020.
- Concerns:
- Fluctuating sales and profitability.
- Stock price volatility.
Technical Analysis:
- Breakout Levels:
- The symmetrical triangle breakout and the falling channel breakout indicate potential upward momentum.
- The breakout at 45 levels and confirmation at the top point of the current candle at 51.40 suggest a continuation of the current trend.
- Target and Support Levels:
- Projected target range based on the symmetrical triangle breakout is 75-76 levels.
- Strong support identified at 30 levels.
Overall Analysis: Considering the financial and technical analyses, investors should approach Ajcon Global Services Ltd cautiously. The positive financial aspects indicate resilience, while the technical breakout signals potential upward movement in the stock price.
Recommendation:
- Buy Level: Consider buying if the stock successfully continues its breakout past 51.40, confirming the bullish trend.
- Target Level: The projected target range based on the symmetrical triangle breakout is 75-76 levels.
- Support Level: Strong support is identified at 30 levels.
Fundamental Consideration: Given the mixed financial indicators, investors should carefully evaluate their risk tolerance and investment objectives. While the positive net profits and stabilized P/E ratio suggest fundamental strength, the fluctuating sales and stock price volatility pose challenges.
Conclusion: Ajcon Global Services Ltd appears to offer a potential buying opportunity, especially with the technical breakout signals. However, investors should exercise caution and conduct further research beyond the provided financial and technical analyses. The fundamental strength, coupled with the identified breakout and support levels, could make it an interesting prospect for those comfortable with a degree of risk in their investment portfolio.