Swan Energy Ltd: Navigating Technical Terrain for Potential Upside
Swan Energy Ltd: Navigating Technical Terrain for Potential Upside
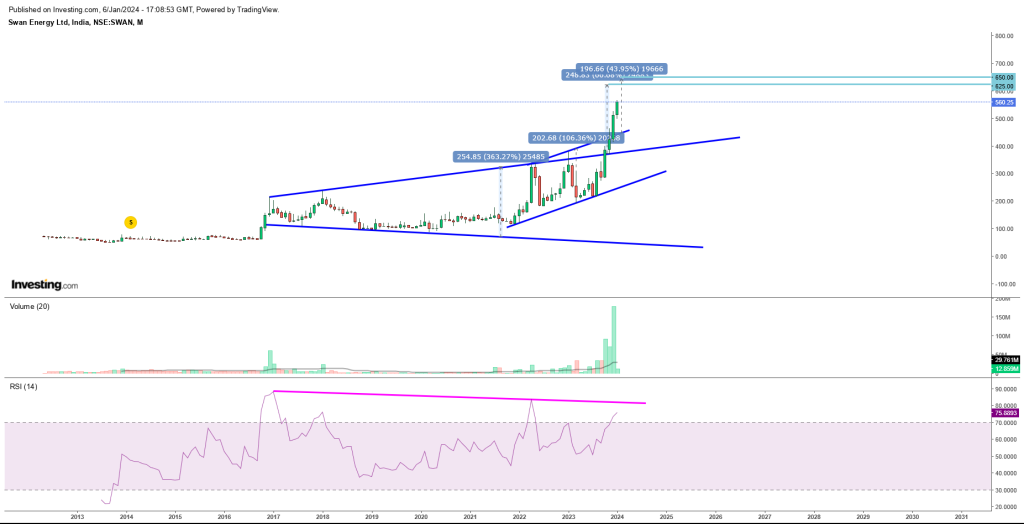
Swan Energy Ltd has been making waves in the financial markets, not just for its operational prowess but also for the intriguing technical patterns displayed on its monthly chart. A careful analysis reveals a confluence of patterns suggesting a potential upward trajectory in the stock’s value.
One notable pattern that captures attention is the “expanding triangle pattern.” The chart showcases a breakout at the 387-400 zone, marking a significant development. According to this pattern, the stock is poised for an upper target range reaching as high as 625. This breakout signifies a shift in market sentiment and sets the stage for a potential bullish trend.
Adding to the technical tapestry is the emergence of a “rising channel pattern.” The stock’s recent higher high and higher low formations substantiate this pattern, culminating in a breakout at the 450 level. The implications of this breakout suggest a potential upward movement with a target range extending to 650. This reinforces the idea that Swan Energy is not only breaking barriers but also charting a course for sustained growth.
Delving deeper into the monthly chart, a compelling observation arises regarding a “bullish positive divergence.” This divergence, revealed through the Relative Strength Index (RSI), underscores the stock’s resilience and potential for a prolonged upward move. Despite making higher highs, the RSI continues to trace lower highs, indicating underlying strength in the stock. The confirmation of this bullish positive divergence at the 340 level solidifies the notion that Swan Energy may be on the cusp of a long-term bullish trend, making it an attractive prospect for long-term investors.
Technically speaking, the stock’s breakout is complemented by robust rising volumes, adding weight to the validity of the patterns identified. The combination of expanding triangle and rising channel patterns, coupled with the bullish positive divergence, forms a compelling case for the stock’s future trajectory.
As of the current chart, Swan Energy is trading at 560, presenting an opportune entry point for investors. However, prudent investors may eye potential corrections, particularly in the 470-480 range, as a strategic entry point. This level aligns with the strong support points of 440 and 370, which further fortify the uptrend.
In conclusion, Swan Energy Ltd stands at the crossroads of technical brilliance and market dynamics, ready to embark on a potential upward journey. The confluence of the expanding triangle pattern, rising channel pattern, and bullish positive divergence paints a picture of resilience and strength. For investors seeking a promising opportunity, Swan Energy’s technical indicators suggest that the stock could be on the brink of a significant move, with a projected upside range of 650-880 in the coming months. As always, it is essential for investors to conduct thorough due diligence and stay attuned to market developments to navigate the dynamic landscape successfully.
About Company
Swan Energy Ltd is an Indian conglomerate that has been a prominent player in various sectors, demonstrating resilience and adaptability over its long history. Founded in 1909, the company has expanded its operations into energy, textiles, and real estate, making significant contributions to India’s industrial landscape.
Energy Sector:
Swan Energy’s presence in the energy sector spans both conventional and renewable sources. The company has been actively involved in power generation and has adapted to the changing dynamics of the energy market by embracing renewable energy projects. This strategic shift aligns with global efforts to transition towards sustainable and environmentally friendly energy solutions.
Renewable Energy Initiatives:
As part of its commitment to sustainability, Swan Energy has ventured into renewable energy projects, including solar and wind power. Investing in these projects not only aligns with environmental goals but also positions the company in a sector with growing importance as the world seeks cleaner and more sustainable energy alternatives.
Textiles Division:
Having its roots in textiles, Swan Energy has a well-established presence in the manufacturing and marketing of textile products. The textiles division represents the company’s traditional strengths and its ability to navigate the complexities of the manufacturing sector.
Real Estate Ventures:
Swan Energy’s involvement in real estate adds another dimension to its business portfolio. The company engages in the development of real estate projects, contributing to the infrastructure and urban development of India. Real estate ventures can provide diversified revenue streams and contribute to the overall economic growth of the regions in which Swan Energy operates.
Infrastructure and Diversification:
The company’s engagement in infrastructure projects, including ports and roads, underscores its commitment to supporting India’s development. Diversifying across multiple sectors is a strategic move that not only mitigates risks associated with sector-specific fluctuations but also positions Swan Energy as a versatile player in the Indian business landscape.
Financial Performance:
Swan Energy’s financial performance is a key factor in evaluating its stability and growth potential. A strong financial foundation enhances the company’s ability to undertake new projects, invest in research and development, and weather economic uncertainties.
Corporate Social Responsibility (CSR):
Corporate social responsibility is increasingly important for companies, and Swan Energy is likely to have engaged in various CSR initiatives. This could include activities related to education, healthcare, environmental sustainability, and community development, showcasing the company’s commitment to social and environmental concerns.
Outlook and Challenges:
While Swan Energy has demonstrated resilience and adaptability, like any company, it faces challenges. Market competition, regulatory changes, and global economic conditions can impact its operations. The company’s ability to innovate, stay abreast of industry trends, and effectively manage challenges will play a crucial role in determining its future success.
In conclusion, Swan Energy Ltd’s multi-sectoral presence, commitment to sustainability, and adaptability to changing market dynamics position it as a notable player in India’s corporate landscape. The company’s ability to balance traditional strengths with innovation will likely influence its success in navigating the complexities of the business environment. For the most up-to-date and specific information, it’s recommended to refer to the latest financial reports, press releases, and official statements from Swan Energy Ltd.
Fundamental Data study
Financial Data Analysis:
Sales:
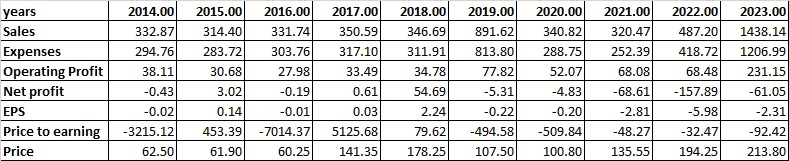
- The sales figures have displayed a fluctuating trend over the years, with a substantial increase observed from 2018 to 2019, reaching a peak in 2019 at INR 891.62 crore. However, the subsequent years witnessed a decline, and by 2023, sales had increased significantly to INR 1438.14 crore.
Expenses:
- The expenses show a general upward trend, with a spike in 2019, aligning with the peak in sales. The following years exhibit a consistent growth in expenses, reflecting the company’s increased operational costs.
Operating Profit:
- The operating profit fluctuates but generally follows the trend of sales. A significant increase is noted in 2019, reaching INR 77.82 crore. This suggests efficient cost management during the peak sales year. The subsequent years also show positive operating profits.
Net Profit:
- Net profit fluctuates, with a notable increase in 2018 and 2019. However, from 2020 onwards, there is a significant downturn, with losses recorded in 2021 and 2022.
Earnings Per Share (EPS):
- The EPS reflects a similar pattern to the net profit, showing a positive trend up to 2019 and turning negative from 2020 onwards.
Price to Earnings (P/E) Ratio:
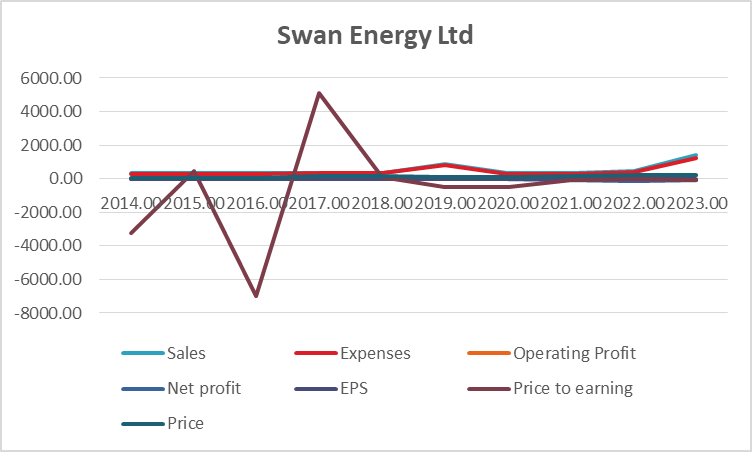
- The P/E ratio is highly volatile, displaying extreme values. The negative values in certain years could be indicative of losses, impacting the investor sentiment. It’s worth noting the sharp increase in P/E in 2022, possibly due to a significant decline in net profit.
Price:
- The stock price exhibits fluctuations, with a notable increase from 2017 to 2018 and a subsequent decrease. However, from 2020 onwards, there is a steady increase in the stock price.
Overall Percentage Growth:
- Despite fluctuations, there is an evident overall growth in sales and stock price from 2014 to 2023. However, the net profit, EPS, and P/E ratio depict a mixed and challenging picture.
Turnaround Factors:
- The significant increase in sales in 2019 could be attributed to successful market strategies or a favorable economic environment.
- Efficient cost management is evident in the positive operating profit during peak sales years.
Strong Factors:
- Consistent growth in sales and operating profit until 2019.
- Positive operating profit from 2014 to 2023.
Weak Factors:
- Substantial losses in net profit from 2020 to 2022.
- Negative EPS in recent years.
- Volatility and extreme values in the P/E ratio, indicating potential instability.
Conclusion: Based on the provided data, the decision to invest in Swan Energy Ltd should be approached with caution. While the company has demonstrated strengths in sales growth and efficient cost management, the recent negative trends in net profit and EPS, along with the extreme volatility in the P/E ratio, raise concerns.
Investors should carefully consider the reasons behind the decline in net profit and assess whether these challenges are short-term or indicative of deeper issues. Additionally, understanding the market conditions and external factors affecting the industry is crucial.
Given the mixed trends and the presence of both strong and weak factors, potential investors are advised to conduct thorough research, possibly including qualitative factors not provided in this analysis, before making an investment decision. The historical data provides a foundation, but a comprehensive evaluation of the company’s current position, future prospects, and industry conditions is essential for a well-informed investment decision.
Final outlook base on technical and fundamental data analysis
Conclusion:
Swan Energy Ltd presents a mixed picture based on the financial and technical analyses. While the company has exhibited strengths such as consistent growth in sales and positive operating profits until 2019, recent years have seen challenges with substantial losses in net profit and negative earnings per share (EPS). The extreme volatility in the price-to-earnings (P/E) ratio further adds complexity to the investment decision.
Financial Analysis:
- Positive aspects include a surge in sales in 2019 and consistent growth in operating profit.
- Negative factors encompass significant losses in net profit from 2020 to 2022, resulting in negative EPS.
- Extreme volatility in the P/E ratio signals potential instability.
Technical Analysis:
- The stock price has displayed fluctuations, with a notable increase from 2017 to 2018 and a steady rise from 2020 onwards.
- Notable breakout levels include the peaks in sales in 2019 and the subsequent increase in stock price.
Conclusion: Considering the mixed trends in financial and technical analyses, potential investors should exercise caution. The recent downturn in net profit raises concerns about the company’s financial health. However, the positive aspects, such as consistent growth in sales and operating profit until 2019, suggest that Swan Energy has the potential for recovery.
Technical Outlook:
- Buy Level: Consider a buy if the stock price sustains above the breakout level of INR 213.80.
- Target Level: The target level could be set around INR 250, reflecting a potential upward movement.
- Support Level: Watch for support around INR 194.25, providing a level where downside risk may be mitigated.
Fundamental Assessment: While the technical analysis provides potential entry and exit points, the fundamental data suggests caution. Investors should thoroughly investigate the reasons behind the recent losses in net profit and assess the company’s ability to overcome these challenges. Understanding the industry landscape, competitive positioning, and any external factors impacting Swan Energy’s performance is crucial.
Final Recommendation: Given the mixed signals and the presence of both positive and negative factors, the decision to invest in Swan Energy Ltd should be approached prudently. Investors are advised to conduct comprehensive due diligence, considering both technical and fundamental aspects. The identified buy level, target level, and support level provide potential reference points, but careful monitoring of the company’s financial health and market conditions is essential.
In summary, Swan Energy Ltd may offer opportunities for recovery, but the investment decision should be based on a thorough understanding of both the technical and fundamental aspects of the company. Potential investors are encouraged to stay informed about any developments that may impact Swan Energy’s performance and reassess their investment strategy accordingly.