Monthly technical chart study
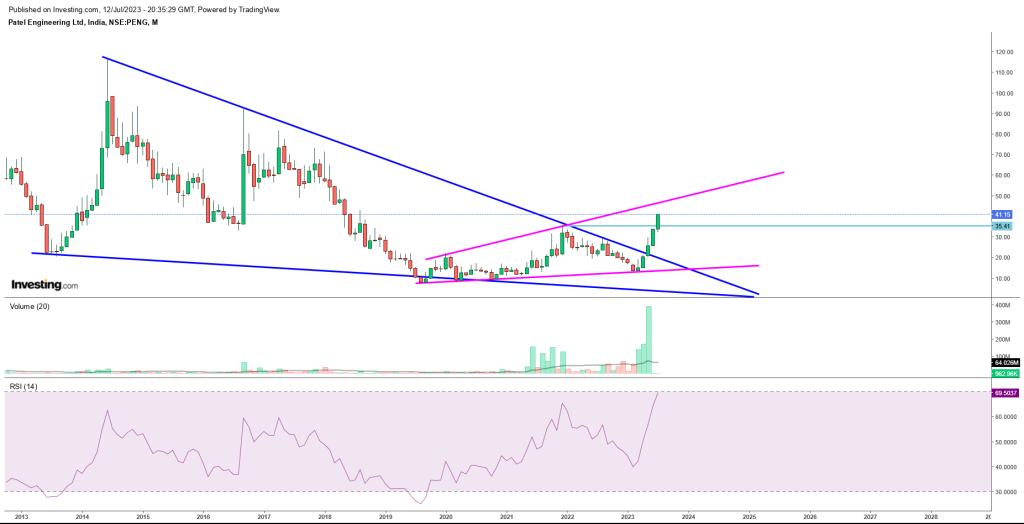
As per the monthly chart study, we can clearly see that stock was falling from year 2008 and in recent years iwth lower top and lower bottom formations, it able to develop falling wedge chart pattern.
The falling wedge chart pattern is a bullish reversal pattern in technical analysis. It consists of two converging trendlines, with the upper trendline sloping downward more steeply than the lower trendline. The pattern suggests a potential upward price movement after a downtrend. Traders look for a breakout above the upper trendline, often accompanied by a decrease in trading volume, as a confirmation of the pattern. Price targets can be estimated by measuring the distance from the initial high to the lower trendline and projecting it upward from the breakout point.
Further we can observe that price is also making expanding wedge pattern on chart.
The expanding wedge chart pattern is a bearish reversal pattern. It consists of two diverging trendlines, with the upper trendline sloping upward more steeply than the lower trendline. The pattern suggests a potential downward price movement after an uptrend.
Falling wedge chart pattern has already given price breakout at 30 level and after breaking lower top pattern at 35-36 it has given further pattern confirmation. and expanding wedge pattern also in making which can try to test upper level of 48 and then after will look for further breakout.
Final technical take
After a long time on chart, stock has given strong pattern reversal and when such pattern reversal occurs at bottom levels then it hit us of trend reversal signal.
so as per pattern stock will try to go till 90-95 levels then after near to 120 and above that it can even go for 475 level. one small hurdle or resistance near 48-50 zone, but then after stock will try to give clear move as per chart.Fundamental Inputs
About company
Patel Engineering Ltd is engaged in the construction of dams, bridges, tunnels, roads, piling works, industrial structures and other kinds of heavy civil engineering works in areas like hydro, irrigation & water supply, urban infrastructure and transport.
Highlights
Projects
The Co has undertaken various projects such as Kameng Hydro Electric Project, SRSP Canal Project, Raichur Sholapur Transmission Project, Rampur Hydro Electric Project, and High Altitude Road projects in various areas among other projects.
Projects Under Execution
As of Q1FY23, Some of the projects under execution are the Subansiri Hydroelectric project, IRCON T2 & T15 (Railway Tunnel), Khalwa Micro Lift Irrigation project, Selapass Road and Tunnel, etc.
Revenue Breakup (FY22)
Hydro: 43%
Irrigation: 7%
Real Estate: 3%
Road: 16%
Tunnel: 27%
Others: 4% [7]
Customers
The customers of the Co include NTPC, NHPC, NHAI, Satluj Jal Vidyut Nigam Ltd, IRCON, etc.
Order Book
The Co’s order book as of June 2022 stood at 17,824 crores. ~69% of project orders are from PSUs, ~26% from State governments, and the rest from international customers. Segment-wise breakup-
Hydroelectric: ~65%
Irrigation: 14%
Tunnel: 13%
Road: 5%
Others: ~3%
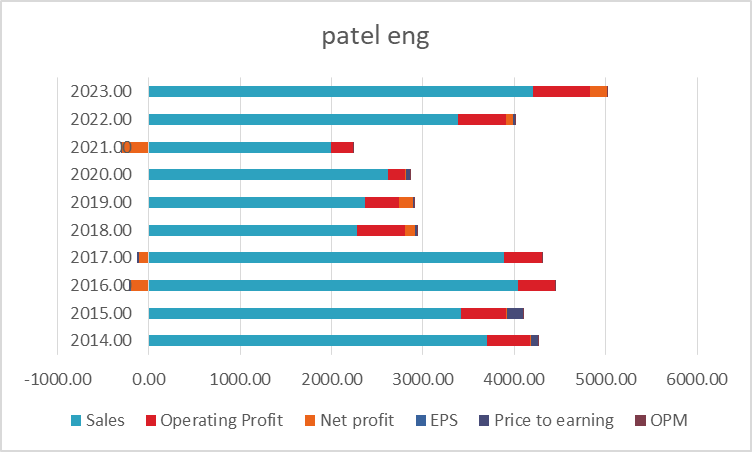
Fundamental data clearly suggest that company is improving on sales, operating profit and even net profit too, and this can suggest turn around in fundamental parameters, and if company is making real effort to turn around its businesses then we can surly see its effects on price of the stocks and even that can be reflect in upcoming results.
Conclusion
Fundamentally turnaround stock giving long term pattern reversal signals on charts, so one need to follow chart for price action and need to follow companies fundamentals if looking to get multibagger return from this stock.
Fundamental is base of any company, because their growth can only decide further price, technical study is mathematical combinations, which can provide you proper entry exit points with the study of historical data, but if you want to create wealth then one to focus on fundamentals insight of that company, which can give you confidence to invest for long term as per chart study.