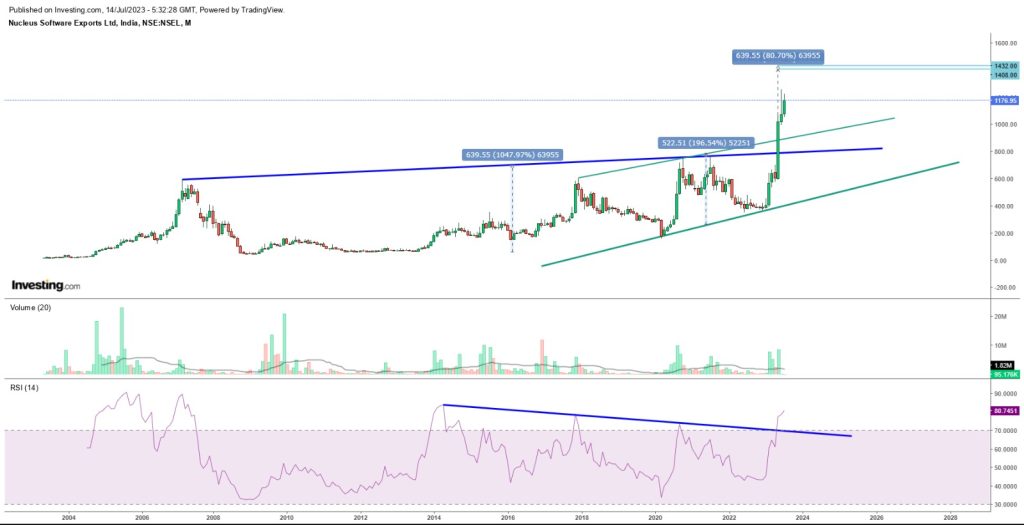
Nucleus Software Exports Ltd monthly long term chart
Technical study for Nucleus Software Exports Ltd
As per long term or monthly chart pattern we can see that few months back stock was trading below resistance level or channel level, but recently it able to give channel breakout above 900 level and at same time it able to break its past resistance too. And this clearly indicate that stock has opened his wings for greater move ahead.
Even if we compare it with rsi its clearly showing us negative bullish divergence breakout on chart, which again happened near to 800 level.
In short stocks has given a long term pattern breakout as per pattern we can expect it to move till 1430-1450 zone, but whenever such a bigger chart pattern appear on long term chart that time stock continues its move for several years and price gives return in multiples so technically we do expect same for this stock too. It can give us further move till 2600-3500-6000 levels too in coming years
Fundamental study for Nucleus Software Exports Ltd
About company
Nucleus Software provides lending and transaction banking products to the global financial services industry. As a pioneer in retail and corporate banking software since 1986.
Their software powers the operations of more than 200 Financial Institutions in over 50 countries, supporting retail lending, corporate banking, cash management, mobile and internet banking, automotive finance and other business areas
Highlight
Leading Software Developer
It offers IT and consultancy services to companies in the banking industry and processes 3,00,000 daily userlogs, 200$ B value of loans and 26 Million transactions per day
Business Verticals
1. Lending:
2. Transaction Banking:
3. Digital Channels:
4. Business Analytics:
Products
1. FinnOne NEO: .
2. FinnAxia:
3. PaySe:
Financial lookout
Market cap – 3150 cr
Stock PE – 28.1
Industry PE – 36.5 ROCE – 27.1%
ROE – 20.3%
Promotor holding – 73.3%
Sales growth 27.60%
operating profit growth 323%
OPM – 24.71%
overall financial figures indicates stringht of the company, stock is trading at 28.1 Pe whereas industry PE is at 36.5, it shows that there is still scope for good growth.
with the sales growth operating profit rising very strongly which indicates company working with strong margins and doing bulk businesses.
| Years | 2014.00 | 2015.00 | 2016.00 | 2017.00 | 2018.00 | 2019.00 | 2020.00 | 2021.00 | 2022.00 | 2023.00 |
| Sales | 346.22 | 353.14 | 348.70 | 372.39 | 411.81 | 484.03 | 520.83 | 513.53 | 497.19 | 634.46 |
| Operating Profit | 68.04 | 65.85 | 30.87 | 53.88 | 58.72 | 79.25 | 94.22 | 129.45 | 37.03 | 156.77 |
| Net profit | 64.34 | 64.71 | 32.47 | 66.16 | 62.55 | 74.54 | 88.99 | 117.95 | 40.91 | 127.79 |
| EPS | 19.86 | 19.97 | 10.02 | 20.42 | 21.57 | 25.70 | 30.69 | 40.67 | 15.26 | 47.68 |
| Price to earning | 10.97 | 8.47 | 19.29 | 12.06 | 18.58 | 13.22 | 5.85 | 11.83 | 27.13 | 13.41 |
| Price | 217.90 | 169.10 | 193.35 | 246.20 | 400.85 | 339.90 | 179.65 | 481.15 | 414.20 | 639.30 |
| OPM | 0.20 | 0.19 | 0.09 | 0.14 | 0.14 | 0.16 | 0.18 | 0.25 | 0.07 | 0.25 |
If we see 10years growth of the company we can see that, sales are almost doubled in past 10 years and operating profit has rised by nearly 130% and net profit rise nearly 100%
and with all these figures company working with strong profit margin too, and as in effect we can see price moves too in a stock.
Below is a fundamental growth chart of company
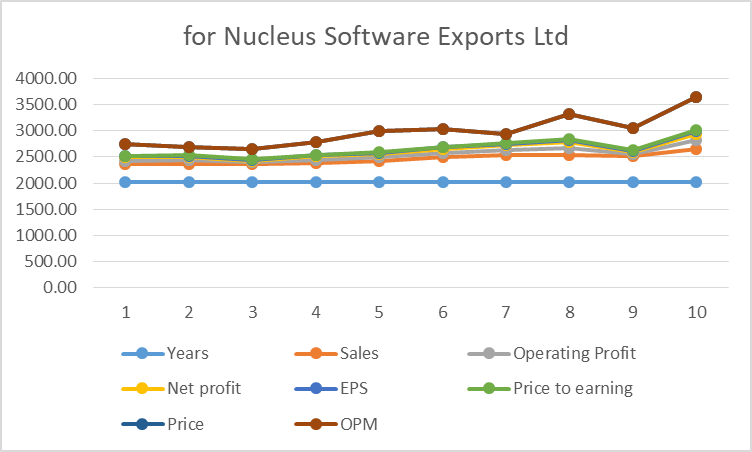
In above chart all fundamental growth of company is clearly visible and we expect it to do more growth in coming years.
so overall our take is, stock as given strong technical breakout with strong fundamental figures so one need to invest in this company for long term prospect which can provide returns in multiples and need to keep watch on growth factor on every quarterly results.