nifty future daily chart
Impressive Chart Patterns and Hidden Bearish Divergence in Nifty Future: A Technical Analysis
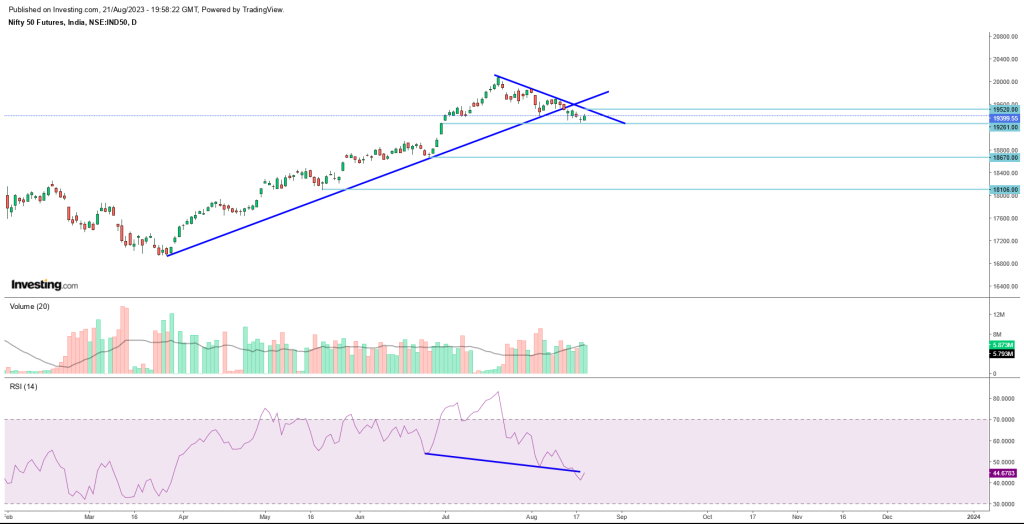
The Nifty 50, a prominent index in the Indian stock market, has recently showcased intriguing chart patterns that warrant close attention from traders and investors alike. As we delve into its technical landscape, we observe a significant breach of a strong support line and a resistance line that is yet to be surmounted. This juxtaposition of key levels raises questions about the future trajectory of the index.
When considering the Relative Strength Index (RSI) alongside the price movement, a fascinating phenomenon emerges. Historically, the Nifty exhibited a pattern of forming higher lows, suggesting underlying strength. However, a contrasting trend emerges in the RSI, where lower lows are evident on the chart. This divergence between price and RSI indicates a potential hidden bearish divergence, further amplified by the breach of the recent bottom at 19,390. This subtle but crucial detail underscores the possibility of impending bearish pressure in the market.
The Nifty 50 technical analysis showcases compelling chart patterns and potential hidden bearish divergence. The recent breach of a robust support line, coupled with trading below a resistant boundary, has drawn attention. Delving deeper, a divergence emerges between price action, which historically exhibited higher lows, and the Relative Strength Index (RSI), reflecting lower lows. This indicates possible hidden bearish divergence, further substantiated by the breach of the recent bottom at 19,390.
Interestingly, the Nifty future demonstrated resilience after bottoming at 19,665, embarking on an upward trajectory punctuated by runaway gaps. Despite a confirmed bearish divergence at the gap point, the index found support and established a low at 19,275.
A critical juncture now exists at 19,260, pivotal for determining the index’s next move. Sustained trading above this level, accompanied by an upward breach of 19,520, might signal a resurgence of the uptrend. This could lead the index towards notable levels such as the psychological 20,000 mark. Conversely, breaking below 19,260 could invite upper resistance at 19,520. Further declines may target support zones at 18,670, 18,106, and 17,650.
As market participants navigate this intricate landscape, the vigilance towards these levels and subsequent price actions will prove pivotal. Informed decisions about market positioning and strategies hinge on discerning the index’s response to these critical junctures. Amid the interplay of chart patterns, hidden divergence, and support-resistance dynamics, staying attuned to these nuances will empower traders and investors to make prudent choices in an evolving market environment.