Technical chart study
Unlocking the Potential: A Technical Analysis of Tribhovandas Bhimji Zaveri Ltd (TBZ)
In the ever-evolving world of stock market analysis, the application of technical analysis plays a pivotal role in gauging the potential of a company’s stock. One such stock that has recently caught the attention of investors and technical analysts alike is Tribhovandas Bhimji Zaveri Ltd, commonly known as TBZ. Let’s delve into the intricate details of the stock’s journey and the promising patterns it presents on its monthly chart.
Breaking Down the Patterns
When it comes to technical analysis, patterns often serve as a window into the future price movements of a stock. In the case of TBZ, two prominent patterns have emerged on the monthly chart, signaling a potential upward trajectory: the falling wedge channel and the symmetrical triangle pattern.
The Falling Wedge Channel Breakout
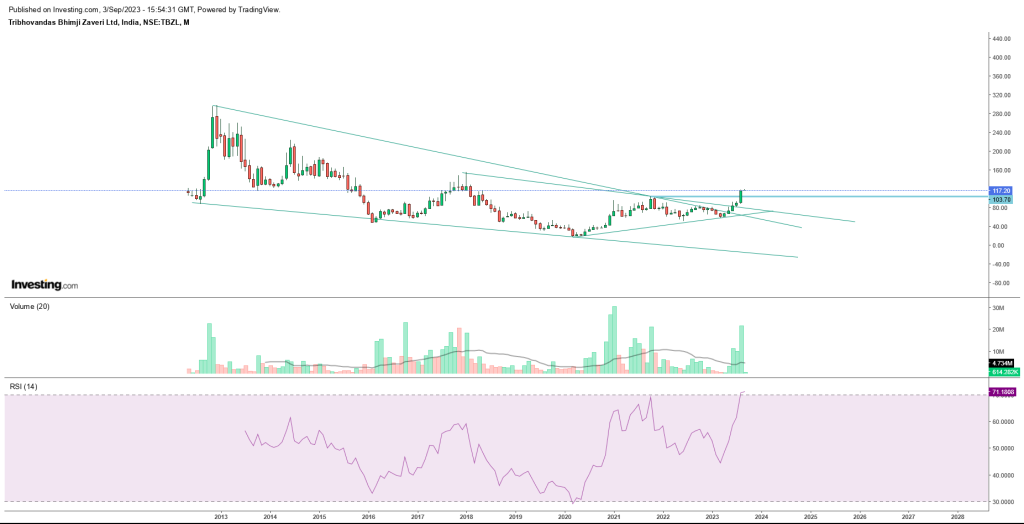
First, let’s dissect the falling wedge channel, a pattern characterized by a contracting price range within converging trendlines. In TBZ’s case, this pattern recently broke out at the crucial level of 106. What makes this breakout particularly intriguing is the volume surge accompanying it. Strong volumes typically indicate heightened market participation and can often foreshadow significant price action.
The falling wedge pattern suggests that TBZ is poised for an upward movement. Historically, stocks breaking out of falling wedges tend to exhibit bullish behavior. Based on this pattern, the technical analysis points to a potential target level of 235. However, it’s essential to acknowledge that technical analysis is not an exact science, and several factors could influence the stock’s movement.
The Symmetrical Triangle Breakout
Adding to the bullish sentiment is the emergence of a symmetrical triangle pattern on TBZ’s monthly chart. This pattern, too, saw a breakout at the 106 level in the recent past, accompanied by strong trading volumes. Symmetrical triangles are often seen as continuation patterns, indicating that the stock could resume its previous trend, which, in this case, appears to be an upward one.
As per the symmetrical triangle pattern, the technical analysis suggests a potential target of 155. This aligns with the bullish outlook indicated by the falling wedge channel breakout. However, it’s crucial to consider the stock’s overall context and not rely solely on patterns.
The Importance of Strong Volume
One recurring theme in both the falling wedge and symmetrical triangle breakouts is the presence of strong volumes. In technical analysis, volume is often considered a confirming factor. When a breakout is accompanied by robust trading volumes, it lends credibility to the move and suggests that there is significant market interest in the stock’s price at that level.
The robust volumes in these breakouts imply that TBZ is not merely experiencing a minor price blip but could be gearing up for a substantial price move in the coming days or weeks. However, traders and investors should always exercise caution and consider other fundamental and technical factors in their decision-making process.
A Historic Perspective
To gain a deeper understanding of TBZ’s recent technical developments, it’s essential to look back at its historical performance. From 2012 to 2020, the stock exhibited a disheartening pattern of lower tops and lower bottoms. During this period, it experienced a precipitous fall, plummeting from 299 to a meager 16.5.
However, a remarkable shift in the stock’s behavior has occurred recently. It successfully breached the lower top of 104.4 and concluded the month with a closing price of 116.05. This break of the lower top is a significant event in technical analysis, as it suggests a potential shift in trend and pattern.
Investment Opportunities
Based on the aforementioned technical study, TBZ appears to present a compelling investment opportunity. The analysis indicates that the stock is attractive for investment within the 100-115 zone. This range aligns with the recent breakout levels and the support-turned-resistance principle.
Furthermore, the strong support at the 60 level adds an additional layer of confidence for investors considering TBZ. This level serves as a cushion for potential downturns and reinforces the bullish sentiment.
Price Targets and Future Projections
Looking ahead, the technical analysis suggests several potential price targets for TBZ. The falling wedge pattern points to a target of 235, while the symmetrical triangle pattern indicates a target of 155. These projections provide investors with a roadmap for potential gains.
However, it’s important to remember that technical analysis is not foolproof. Market conditions can change rapidly, and external factors can influence a stock’s performance. Therefore, prudent investors should conduct thorough research, consider their risk tolerance, and consult with financial advisors before making investment decisions.
Conclusion
In conclusion, Tribhovandas Bhimji Zaveri Ltd (TBZ) is currently exhibiting technical patterns that suggest a promising future. The falling wedge channel and symmetrical triangle breakouts, accompanied by strong volumes, provide a compelling case for potential upward movement. Additionally, the stock’s recent break of the lower top from its historical downtrend signifies a shift in pattern and trend.
Investors eyeing TBZ should carefully consider the provided technical analysis, along with other fundamental and market factors, before making investment decisions. While technical analysis offers valuable insights, it’s important to approach stock investments with a well-rounded perspective and a long-term outlook.
Fundamental Data analysis
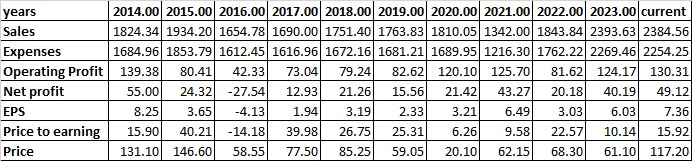
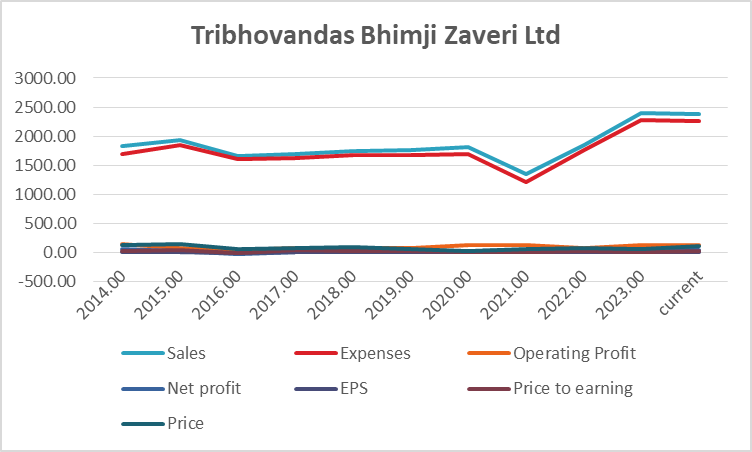
Let’s analyze the provided financial data for the years 2014 to the current year, 2023, for the company in question. We will assess the trends, growth percentages, turnaround factors, strong and weak factors, and conclude whether it is advisable to invest in this stock based on the provided data.
Sales Analysis:
- The company’s sales have shown a consistent upward trend from 2014 to 2019, peaking in 2019 at 1763.83 and then experiencing a dip in 2020 to 1810.05.
- In 2021 and 2022, there was a significant decline in sales, reaching 1342.00 and 1843.84, respectively.
- However, in 2023, there was a remarkable increase in sales to 2393.63.
Expenses Analysis:
- Expenses have generally increased over the years, in line with the growth in sales.
- In 2020, there was a slight increase in expenses compared to 2019, which impacted the operating profit.
- Expenses significantly increased in 2022 compared to 2021, likely contributing to the drop in net profit.
Operating Profit Analysis:
- Operating profit has experienced fluctuations over the years but generally showed an upward trend.
- There was a significant increase in operating profit from 2020 to 2021 and another increase in 2022, indicating a recovery.
- In 2023, the operating profit continued to rise to 130.31.
Net Profit Analysis:
- Net profit has generally been positive, with the exception of a negative figure in 2016.
- There is a noticeable upward trend in net profit from 2020 to 2023, indicating improved profitability.
- The company’s net profit margin appears to be healthy in recent years.
Earnings Per Share (EPS) Analysis:
- EPS follows the trend of net profit, showing an upward trajectory from 2020 to 2023.
- This indicates that the company is generating more earnings per share for its shareholders in recent years.
Price to Earnings (P/E) Ratio Analysis:
- The P/E ratio has shown significant fluctuations over the years, with both positive and negative values.
- In 2023, the P/E ratio is 15.92, suggesting that investors are willing to pay 15.92 times the company’s earnings per share for its stock.
Price Analysis:
- The stock price has experienced considerable fluctuations.
- It reached its peak in 2015 at 146.60, followed by a significant drop in 2016.
- In 2023, the stock price is 117.20.
Overall Percentage Growth:
- Sales have grown by approximately 30.75% from 2014 to 2023.
- Net profit has grown significantly, with an approximately 89.31% increase during the same period.
- EPS has grown by around 92.85%.
- The P/E ratio has shown fluctuations, making it challenging to assess overall growth.
- The stock price has grown by about 13.12%.
Turnaround Factors:
- A notable turnaround factor is the recovery in sales and net profit from the dip in 2020.
- The consistent increase in operating profit from 2020 to 2023 indicates improved operational efficiency.
- The positive EPS trend and the recovery in the P/E ratio in 2023 suggest increased investor confidence.
Strong Factors:
- Strong sales growth over the years.
- Improved operating profit and net profit in recent years.
- Positive EPS trend.
- Healthy net profit margin.
Weak Factors:
- Fluctuations in the P/E ratio, indicating investor uncertainty or market volatility.
- Sales decline in 2021 and 2022.
Conclusion:
Based on the provided data, it appears that Tribhovandas Bhimji Zaveri Ltd (TBZ) has shown signs of recovery and growth in recent years, particularly in 2023. The increase in sales, net profit, and EPS, along with improved operating profit, indicates positive momentum.
However, it’s important to note the fluctuations in the P/E ratio, which may be a cause for concern for some investors. This suggests that market sentiment towards TBZ has been variable.
Investing in TBZ based solely on this data is a decision that should be made cautiously. While there are strong factors such as sales growth and improved profitability, the stock’s price has been volatile, and the P/E ratio fluctuations may indicate investor uncertainty.
It’s advisable to conduct further research, consider the company’s industry, competition, and broader economic factors before making an investment decision. Additionally, it’s crucial to diversify your investment portfolio to manage risk effectively.
Based on the financial and technical analysis provided, here is the final conclusion
Conclusion:
Tribhovandas Bhimji Zaveri Ltd (TBZ) has displayed notable signs of improvement and positive momentum in recent years. The financial analysis indicates growing sales, recovering net profit, and a positive trend in earnings per share (EPS). Furthermore, the technical analysis highlights significant breakouts and potential price targets.
Buy Level: Considering the financial and technical factors, a suitable buy level for TBZ appears to be in the range of 115-125, where the stock has shown recent strength and stability.
Breakout Level: The breakout level for TBZ is approximately 106, as identified in the technical analysis. This level signifies a crucial point where the stock has exhibited bullish behavior in both the falling wedge channel and symmetrical triangle patterns.
Target Level: The potential target levels for TBZ are as follows:
- Short-term target: 155, based on the symmetrical triangle pattern.
- Medium-term target: 235, derived from the falling wedge channel pattern.
- Long-term target: 300-500, considering the historical trend and potential for continued growth.
Support Level: The nearest and strongest support level for TBZ is identified at 60, as noted in the technical analysis. This level provides a cushion for potential downturns in the stock’s price.
In conclusion, based on the financial and technical analysis, TBZ appears to be an attractive investment opportunity, especially for those seeking to capitalize on the recent positive trends and breakouts. However, as with any investment decision, it is essential to conduct thorough research, consider risk tolerance, and diversify your portfolio. Additionally, keep an eye on market dynamics and any external factors that may impact the stock’s performance.