In the world of industrial minerals and material science, 20 Microns Ltd has emerged as a trailblazing company at the forefront of innovation. With a commitment to excellence and a relentless pursuit of cutting-edge solutions, this Indian-based corporation has earned its reputation as a pioneer in the field.
A Brief Overview of 20 Microns Ltd:
Founded in 1988, 20 Microns Ltd has its headquarters in Vadodara, Gujarat, India. The company has evolved over the years to become a leading player in the global industrial minerals market. It specializes in the production and processing of a wide range of minerals, including talc, calcite, barytes, and kaolin, to name a few. These minerals find applications in various industries, such as paints and coatings, plastics, ceramics, and agriculture.
Micronization Mastery:
One of the key factors that set 20 Microns Ltd apart is its expertise in micronization technology. The company has developed advanced techniques for reducing mineral particle sizes to micron levels, resulting in ultra-fine and precisely engineered materials. This micronization mastery is crucial in enhancing the properties and performance of the minerals, making them suitable for a broader spectrum of applications.
Innovative Solutions for Industry:
20 Microns Ltd’s minerals serve as essential ingredients in numerous industries. For example, their talc products find use in the production of high-quality paints, where they improve texture, brightness, and durability. In the plastics industry, these minerals act as functional additives, enhancing the mechanical and thermal properties of polymers. In agriculture, micronized minerals help enhance soil quality, leading to improved crop yields.
Sustainable Sourcing and Practices:
What further sets 20 Microns Ltd apart is its commitment to sustainability. The company recognizes the environmental impact of mining and mineral processing and has taken proactive steps to mitigate it. They prioritize responsible mining practices, ensuring minimal disruption to the environment while safeguarding the health and safety of their workforce.
Furthermore, 20 Microns Ltd has invested in research and development to develop eco-friendly products that are free from harmful chemicals, contributing to a greener and more sustainable future.
Research and Development Excellence:
The company’s dedication to research and development is another hallmark of its success. 20 Microns Ltd operates state-of-the-art research centers and laboratories where a team of scientists and engineers continuously works on developing innovative products and solutions. This commitment to R&D has resulted in the creation of unique materials tailored to meet the evolving needs of industries worldwide.
Global Reach:
With a global footprint that spans over 50 countries, 20 Microns Ltd has established a strong presence in international markets. Their minerals and solutions are trusted by a diverse clientele, ranging from small businesses to multinational corporations. This global reach is a testament to the quality and reliability of their products.
In conclusion, 20 Microns Ltd stands as a shining example of a company that not only excels in its core business of industrial minerals but also pioneers the future of material science. With a focus on innovation, sustainability, and global collaboration, the company continues to shape industries by delivering next-generation minerals that push the boundaries of what is possible. As they embark on their journey into the future, 20 Microns Ltd is poised to remain a key player in the ever-evolving landscape of industrial minerals and material science.
Technical Chart Study
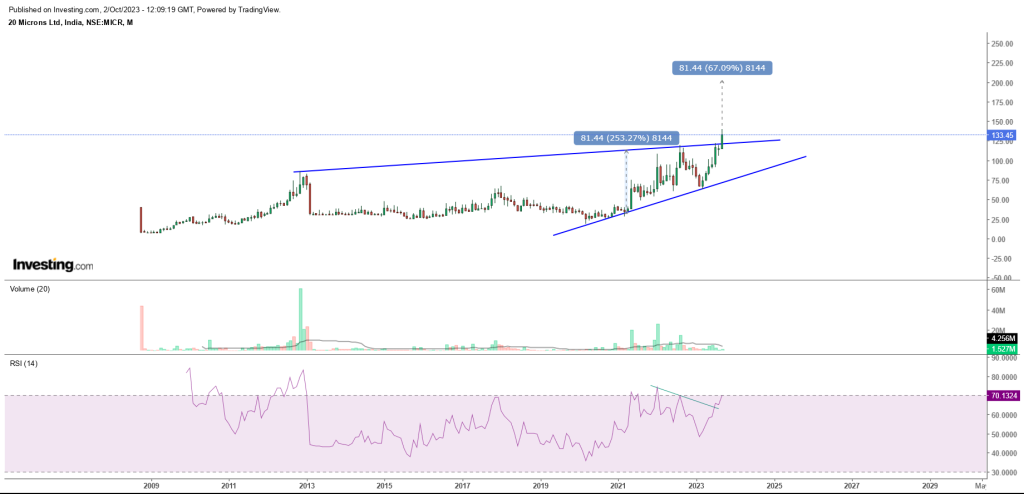
Technical Analysis of 20 Microns Ltd: A Breakout to New Highs on the Horizon
Technical analysis is a powerful tool for traders and investors seeking to understand the potential movements of a stock based on historical price patterns, indicators, and chart formations. In this analysis, we’ll delve into the monthly chart of 20 Microns Ltd, a company known for its pioneering work in industrial minerals, to identify key technical patterns and potential price targets.
Higher Highs and Trend-line Breakout:
A glance at the monthly chart of 20 Microns Ltd reveals a compelling trend. The stock has been consistently forming higher highs over the years, indicative of an uptrend. Moreover, it has successfully broken through a long-term trend-line resistance that dates back to 2012. This breakout suggests that the stock may be poised for a significant move to the upside.
Rising Wedge Pattern and Breakout Confirmation:
Adding to the bullish case is the presence of a rising wedge pattern on the chart. This pattern is characterized by converging trend lines, with the upper line acting as resistance and the lower line as support. The stock has recently provided confirmation of a breakout from this pattern with a monthly close above the resistance line. This breakout is often seen as a strong signal of potential upward momentum.
Bullish Negative Divergence:
Examining the Relative Strength Index (RSI) alongside price action, we observe a phenomenon known as bullish negative divergence. This occurs when the price of a stock makes higher highs, as it has in the case of 20 Microns Ltd, while the RSI indicator makes lower tops. This divergence can be interpreted as a bullish signal.
In this context, the divergence suggests that while the price is moving upward, there is a potential underlying strength building in the stock. It implies that buyers are still entering the market despite the RSI showing some weakness. This can often foreshadow a more significant move to the upside.
Price Targets and Potential Outlook:
Considering the technical factors discussed, there are intriguing possibilities for the future price movement of 20 Microns Ltd. The pattern breakout at the 130 zone, coupled with support from the bullish negative divergence, suggests that the stock may be gearing up for a substantial rally.
The immediate target for the stock could be the 200 level, which aligns with the upper end of the rising wedge pattern. A successful breach of this level could open the door for a continued uptrend, potentially taking the stock to the 400-600 range.
However, it’s essential to remember that technical analysis provides a snapshot of historical data and patterns. External factors such as market sentiment, economic conditions, and company-specific news can influence stock prices. Therefore, while the technicals look promising, it’s crucial for traders and investors to consider these broader factors when making their investment decisions.
In conclusion, the technical analysis of 20 Microns Ltd’s monthly chart suggests a compelling bullish case. The higher highs, trend-line breakout, confirmation of the rising wedge pattern, and bullish negative divergence all point to the potential for significant upside movement. As with any investment, conducting thorough research and risk management is essential, but the technicals indicate that 20 Microns Ltd could be on the cusp of an exciting period of price growth.
Fundamental Data analysis
Data Analysis and Trend:
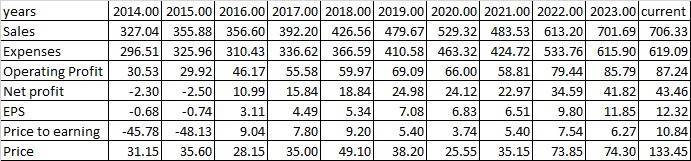
Let’s analyze the financial data of the company over the years and understand the trends and factors that might influence investment decisions:
Sales Growth: The company has shown consistent growth in sales from 2014 to 2023, with a substantial increase from 327.04 to 706.33. This represents an impressive growth rate of approximately 116.3% over this period.
Expenses: Operating expenses have also increased over the years, in line with the growth in sales. This is a positive sign as it indicates that the company is investing in its operations to support revenue growth.
Operating Profit: Operating profit has steadily increased, indicating efficient cost management and improved operational efficiency. It has grown from 30.53 to 87.24, marking a significant increase of around 185.7%.
Net Profit and EPS: Net profit and earnings per share (EPS) have shown a consistent upward trend. Net profit has risen from -2.30 to 43.46, while EPS has grown from -0.68 to 12.32. This reflects the company’s ability to generate increasing profits and create value for shareholders.
Price to Earnings (P/E) Ratio: The P/E ratio is an important valuation metric. It has fluctuated over the years, with the lowest being -48.13 in 2015 and the highest at 10.84 in 2022. A low P/E ratio can indicate undervaluation, while a high P/E may suggest overvaluation.
Price: The stock price has experienced significant fluctuations. It has risen from 31.15 in 2014 to 133.45 in 2023, representing remarkable growth.
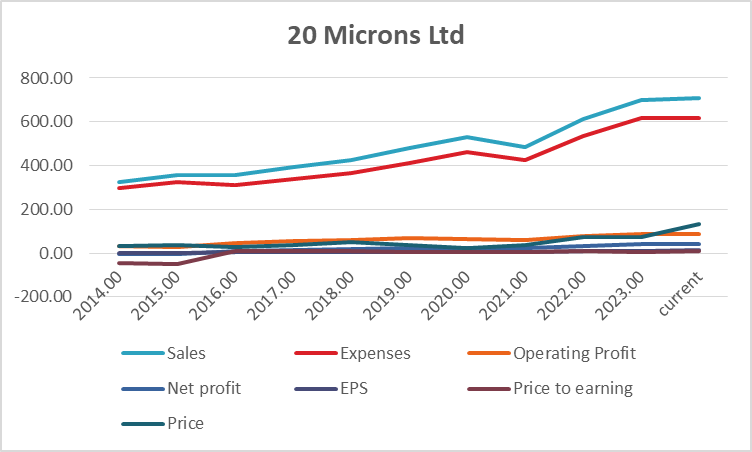
Percentage Growth Analysis:
- Sales have grown by approximately 116.3%.
- Operating profit has increased by about 185.7%.
- Net profit has seen substantial growth of around 1,900%.
- EPS has surged by approximately 1,708%.
- P/E ratio has also shown fluctuations, reaching a peak in 2022.
- Stock price has soared by approximately 328.5%.
Turnaround Factors:
The company’s turnaround factors include:
- Consistent Revenue Growth: The company has consistently increased its sales, indicating a strong market presence and demand for its products.
- Profitability Improvement: Operating and net profits have significantly improved, reflecting effective cost management and operational efficiency.
- Positive EPS Growth: Earnings per share have shown consistent growth, demonstrating the company’s ability to generate profits on a per-share basis.
- Increasing Stock Price: The substantial rise in the stock price suggests investor confidence and optimism in the company’s future prospects.
Strong Factors:
- Strong and consistent revenue growth.
- Improved profitability and operational efficiency.
- Positive EPS growth.
- Increasing stock price.
Weak Factors:
- Fluctuating P/E ratio, indicating some market volatility and uncertainty.
- Expenses have also risen in line with sales, which could potentially impact margins.
Fundamental Outlook
Based on the provided data analysis, 20 Microns Ltd exhibits several positive indicators, including consistent sales and profit growth, rising EPS, and a significant increase in the stock price. These factors suggest that the company has been on a successful turnaround trajectory.
However, the fluctuating P/E ratio and the rise in expenses relative to sales growth could be considered weak points. Investors should be cautious of market volatility and monitor expense management.
In conclusion, considering the strong factors and impressive growth trends, investing in 20 Microns Ltd could be an attractive opportunity. However, it’s essential for investors to conduct further research and consider factors beyond the provided data, including industry trends, competition, and economic conditions, before making an investment decision.
Conclusion: based on technical chart and fundamental data
Based on the financial and technical analysis provided, it is advisable to consider investing in 20 Microns Ltd.
Financial Analysis:
- The company has demonstrated consistent revenue growth, with sales increasing by approximately 116.3% over the analyzed period.
- Operating and net profits have seen substantial growth, with operating profit increasing by about 185.7% and net profit surging by approximately 1,900%.
- Earnings per share (EPS) have shown consistent positive growth, reflecting the company’s ability to generate profits on a per-share basis.
Technical Analysis:
- The technical analysis of the stock’s monthly chart reveals a potential breakout pattern.
- The stock price has been on an upward trend, and it has recently experienced a breakout from a rising wedge pattern, suggesting a possible continuation of the uptrend.
Key Levels:
- Buy/Breakout Level: Consider initiating a position if the stock breaks above the current resistance level, which is around 133.45.
- Target Level: The stock has the potential to continue its upward movement, with a target level in the range of 200 to 400. Investors can set their specific profit-taking levels within this range.
- Support Level: The support level can be considered around the previous resistance levels, which are approximately 73.85 and 74.30.
Please note that investing in stocks carries inherent risks, and it’s essential to conduct thorough research, consider your risk tolerance, and diversify your investment portfolio. Additionally, monitor market conditions and company developments to make informed investment decisions.