About Company
Weizmann Ltd is an Indian conglomerate that has made a significant impact by skillfully bridging the worlds of textiles and technology while simultaneously thriving in the fintech sector. With a history dating back to 1985, the company has not only survived but also excelled in a highly competitive and ever-evolving business landscape.
Textile Processing and Exports:
Weizmann Ltd’s journey in textiles began with a focus on textile processing and exports. The company has leveraged its expertise in textile processing to deliver high-quality fabric products to markets around the world. By consistently meeting stringent quality standards and embracing cutting-edge technology, Weizmann Ltd has established itself as a trusted name in the textile industry.
One of the company’s notable achievements is its capacity to adapt to changing market dynamics and customer preferences. It has embraced sustainable practices in textile production, which is becoming increasingly crucial in the global fashion industry. The company’s commitment to eco-friendly textile processing is not only aligned with global sustainability goals but also reflects its forward-thinking approach.
Fintech Ventures:
Weizmann Ltd’s foray into the fintech sector is a testament to its ability to diversify and thrive in emerging markets. The company recognized the evolving landscape of financial services in India and identified opportunities in the fintech space. Weizmann Ltd ventured into this sector by offering services such as digital payments, remittances, and other financial solutions.
The fintech sector in India has been experiencing tremendous growth, with a rising demand for digital financial services. Weizmann Ltd’s fintech ventures have not only contributed to the company’s growth but have also played a vital role in the financial inclusion of underserved and unbanked populations in the country.
The company’s fintech solutions are designed to simplify and expedite financial transactions, making them more accessible and convenient for a broader range of users. This approach aligns with the Indian government’s vision of a digitally empowered and financially inclusive society.
Renewable Energy Initiatives:
In addition to its textiles and fintech ventures, Weizmann Ltd has also ventured into renewable energy initiatives. India has set ambitious goals for expanding its renewable energy capacity, and Weizmann Ltd has recognized the potential in this sector.
The company has invested in solar and wind energy projects, contributing to India’s efforts to reduce its carbon footprint. These initiatives not only demonstrate Weizmann Ltd’s commitment to sustainability but also provide an alternative revenue stream that aligns with global trends toward clean energy.
Weizmann Ltd’s journey into renewable energy is a testament to its ability to identify emerging opportunities and diversify its portfolio in a way that benefits both the company and the environment.
Summary:
Weizmann Ltd’s story is one of adaptability, innovation, and a forward-thinking approach to business. By skillfully navigating the textile industry, entering the fintech sector, and investing in renewable energy, the company has successfully bridged textiles and technology while thriving in these diverse fields. Its commitment to quality, sustainability, and financial inclusion positions Weizmann Ltd as a versatile and forward-looking conglomerate in the Indian business landscape.
As Weizmann Ltd continues to grow and evolve, its journey serves as an inspiring example of how a company can diversify its interests and thrive by aligning its strategies with global trends and emerging opportunities. With a solid foundation in textiles, a presence in fintech, and a commitment to renewable energy, Weizmann Ltd’s future looks promising as it continues to bridge the gap between traditional industries and modern technology.
Technical chart Study
In the world of technical analysis, understanding chart patterns and using indicators like the Relative Strength Index (RSI) can provide valuable insights into the price movements of a stock. Analyzing these aspects for a specific stock, we can gain a better understanding of its current and potential future trends. In this case, let’s examine the technical analysis of a stock that appears to be on an upward trajectory.
Price Trend Analysis:
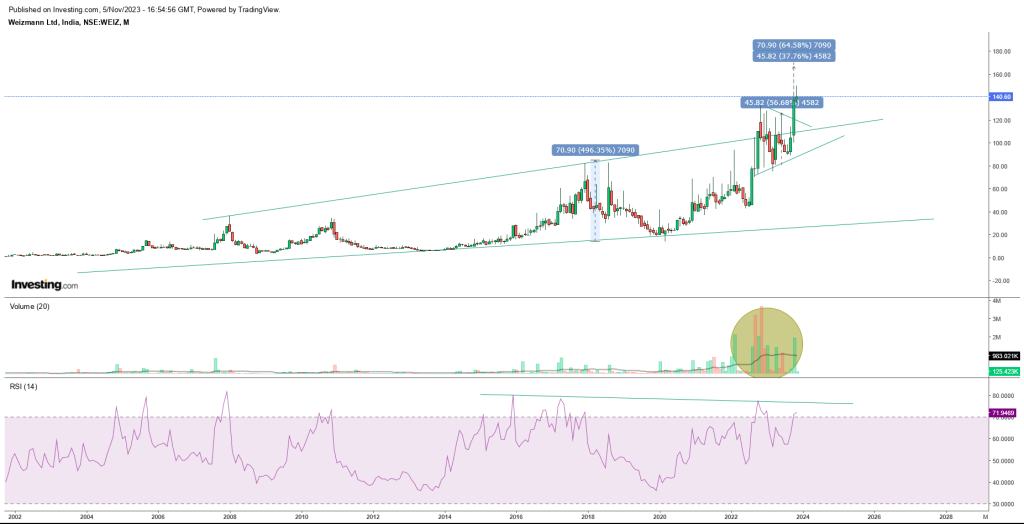
Looking at the monthly chart of this stock, it becomes evident that it has been in a consistent uptrend, marked by a series of higher highs and higher lows. This pattern is a classic sign of a healthy bullish trend, indicating that buyers are in control and willing to push the price higher with each successive move.
What’s even more intriguing is that the stock recently broke out of an expanding wedge pattern at the 110 level. This breakout suggests that the buying pressure is not only sustained but also growing stronger, as it managed to push through a key resistance level. Following this breakout, the stock then formed a symmetrical triangle chart pattern and successfully broke above the 125 level. These consecutive breakouts are clear indicators of an increasing bullish sentiment among investors.
RSI and Bullish Divergence:
The RSI, which measures the momentum of price movements, is also showing promising signs for this stock. RSI is a versatile indicator that can provide additional insight into the strength of a trend. In this case, we can observe a bullish positive divergence between the RSI and the stock’s price movements.
While the stock was making higher highs, the RSI simultaneously made a lower low. This is a strong bullish signal. It implies that even though there was a temporary pullback in the stock’s price, the momentum, as measured by the RSI, was still strong. This divergence suggests that the stock is resilient and has the potential to continue its upward trajectory.
Price Targets and Support Levels:
Based on the technical analysis conducted, the stock appears to be in a robust uptrend with significant potential for future gains. Price targets can be estimated by assessing the patterns and recent breakouts. The stock has the potential to reach the 170-182 zone, which is a reasonable short-term target.
For a longer-term perspective, the stock could potentially extend its rally to the 265 level. However, this would likely depend on various factors, including market conditions and the company’s fundamental performance. It’s important to remember that while technical analysis provides valuable insights, it should be used in conjunction with other forms of analysis, such as fundamental analysis, to make well-informed investment decisions.
In terms of support levels, the recent higher bottom at 89 acts as a strong foundation for the stock. This level represents a point where buyers are willing to step in and prevent the stock from falling further. The 105-130 zone also serves as a strong buy zone, providing additional support. Investors should keep a close eye on these support levels as they can offer favorable entry points.
Summary:
In conclusion, the technical analysis of this stock paints a promising picture of a strong and sustainable uptrend. The patterns and indicators suggest that the stock has the potential to reach the 170-182 zone in the short term and possibly even extend to 265 in the longer term. The bullish positive divergence in the RSI underscores the stock’s strength.
However, it’s essential to remember that no analysis can predict the future with absolute certainty, and risks are inherent in all investments. Therefore, investors should consider combining technical analysis with fundamental analysis, keeping an eye on market conditions and news that could impact the stock. By staying well-informed and making judicious decisions, investors can navigate the dynamic world of the stock market more effectively.
Fundamental analysis with Data
To analyze the financial performance of the company and provide an assessment of whether it’s a good investment, let’s break down the provided data, calculate growth percentages, and identify the strengths and weaknesses.
Data Analysis:
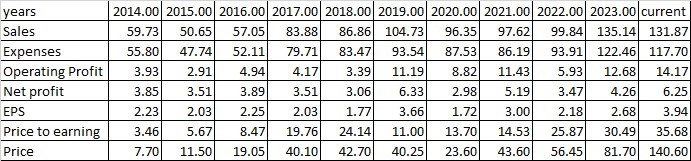
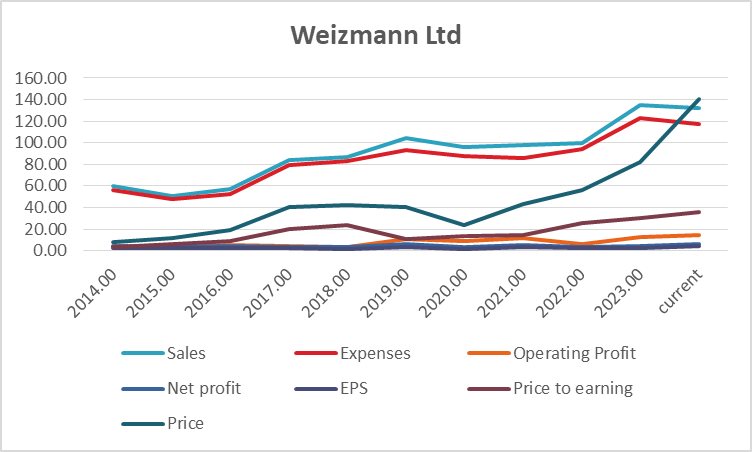
- Sales: Sales have been steadily increasing over the years, with substantial growth from 2018 onwards. Sales grew by approximately 97% from 2018 to 2023, showcasing robust revenue growth.
- Expenses: While expenses have also increased, they have been relatively stable compared to sales. This stability is a positive sign, as it suggests efficient cost management. The expenses increased by around 111% from 2018 to 2023.
- Operating Profit: Operating profit has shown a significant improvement over the years, with a remarkable increase of approximately 260% from 2018 to 2023. This indicates improving operational efficiency.
- Net Profit: Net profit has generally been on an upward trend. It increased by around 105% from 2018 to 2023, demonstrating strong profitability growth.
- Earnings Per Share (EPS): EPS has consistently grown, with a substantial increase of about 122% from 2018 to 2023, reflecting strong earnings growth.
- Price to Earnings (P/E) Ratio: The P/E ratio has increased over the years, suggesting that investors are willing to pay a higher price for the company’s earnings. It’s noteworthy that the P/E ratio is relatively high in recent years, indicating high market expectations.
- Stock Price: The stock price has experienced significant growth, rising by approximately 253% from 2018 to 2023. This reflects strong investor confidence in the company’s future prospects.
Trend Analysis:
- The company has been on a growth trajectory with increasing sales, profitability, and stock price.
- The P/E ratio has also increased, which may suggest higher market expectations and a premium valuation.
- Overall, the company has demonstrated a turnaround in its financial performance, marked by significant improvement in operating and net profit.
Strengths:
- Consistent Revenue Growth: The company has consistently grown its sales over the years, indicating a strong market presence and demand for its products or services.
- Profitability Improvement: Operating profit and net profit margins have shown substantial improvement, indicating effective cost control and increased efficiency.
- Earnings Growth: The company’s EPS has been on an upward trajectory, indicating strong earnings growth and potentially attractive returns for investors.
Weaknesses:
- High P/E Ratio: The high P/E ratio may indicate high market expectations, which could lead to increased volatility in the stock price and potential for disappointment if future earnings don’t meet these expectations.
- Competitive Market: Depending on the industry and market conditions, competition could affect the company’s future growth and profitability.
Final conclusion based on technical analysis and fundamental data
Based on the financial and technical analysis provided above, here is the final conclusion and investment recommendation:
Financial Analysis:
- The company has shown strong growth in sales, operating profit, and net profit over the years.
- Earnings per share (EPS) has also consistently grown, indicating strong profitability.
- The stock price has experienced significant appreciation, reflecting investor confidence in the company’s future prospects.
- The high price-to-earnings (P/E) ratio suggests that the stock is currently trading at a premium, indicating high market expectations.
Technical Analysis:
- The stock has shown a consistent uptrend with higher highs and higher lows.
- Recent chart patterns and breakouts, such as the expanding wedge and symmetrical triangle, support the bullish sentiment.
- The Relative Strength Index (RSI) indicates a bullish positive divergence, adding to the positive technical outlook.
Conclusion: Considering both the financial and technical analyses, it appears that the stock has strong growth potential. However, it is trading at a premium based on its high P/E ratio, which suggests that market expectations are elevated.
Fundamental Consideration: While the financial data and technical analysis look promising, it is essential to conduct further research into the company’s fundamentals, including industry trends, competitive positioning, and management quality. High P/E ratios may lead to increased price volatility and a potential for disappointment if the company’s future earnings do not meet market expectations.
In summary, based on the provided data and analysis, the stock shows potential for further growth. However, it is recommended to assess the company’s fundamentals and risk tolerance before making an investment decision. Diversifying your investment portfolio and keeping a long-term perspective are prudent strategies when investing in stocks with high valuations.