Unlocking Potential: A Technical Analysis of Reliance Industrial Infrastructure Ltd’s Chart Patterns
Introduction:
Reliance Industrial Infrastructure Ltd (RIIL) has emerged as a compelling investment opportunity, showcasing a series of intriguing technical chart patterns that indicate potential bullish momentum. In this analysis, we delve into the significant patterns identified on the monthly chart, shedding light on the breakout levels, targets, and supporting indicators that paint a promising picture for investors.
Cup and Handle Pattern Breakout:
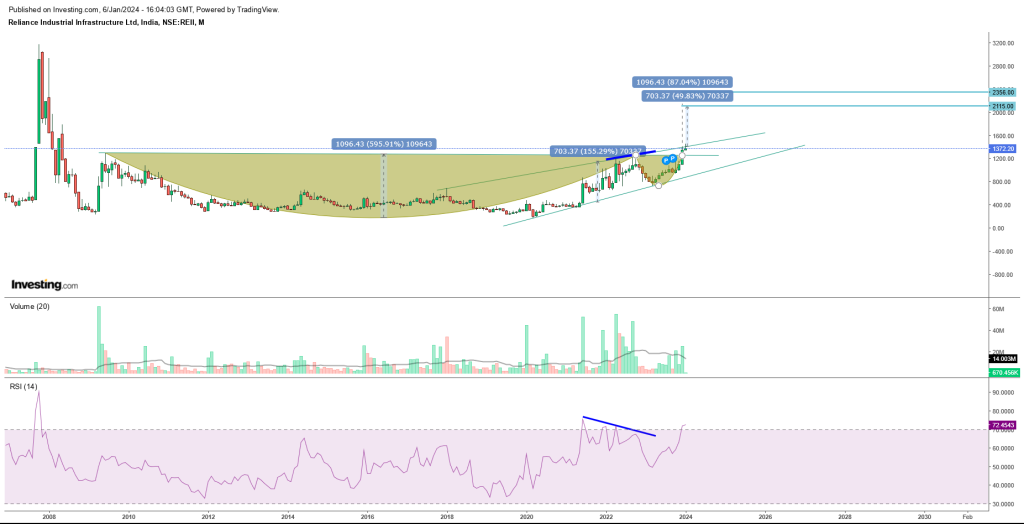
The chart reveals the formation of a classic “cup and handle” pattern, a reliable bullish continuation pattern. The breakout at the 1260 level is a noteworthy development, signaling a potential upward trajectory. The upper target of 2400 appears plausible, providing investors with a clear benchmark for assessing the stock’s performance in the coming months.
Rising Channel Pattern Breakout:
In addition to the cup and handle pattern, the emergence of a “rising channel” pattern adds another layer of optimism. The breakout at 1400 strengthens the bullish sentiment, with an anticipated target range extending up to 2115. This pattern underscores the stock’s ability to sustain an upward trend, aligning with the broader market sentiment.
Bullish Positive Divergence with RSI:
Prior to the cup and handle pattern formation, a crucial indicator comes into play – the Relative Strength Index (RSI). The chart showcases a “bullish positive divergence” identified through the RSI, with the breakout occurring at the 1257 level. This divergence serves as a strong confirmation of the underlying bullish momentum, providing additional support to the overall technical analysis.
Volume Confirmation:
Volume analysis further corroborates the bullish outlook. Significant spikes in volume accompany important upswings and pattern developments, indicating a heightened level of market interest. This volume confirmation reinforces the reliability of the identified patterns, suggesting a genuine and sustained interest in RIIL within key price ranges.
Technical Targets and Future Outlook:
With the breakout levels at 1257 and 1400, RIIL is currently trading at 1372, presenting an opportune entry point within the strong buy zone. The projected upward range towards 2400 is substantiated by the combination of cup and handle and rising channel patterns. Beyond this, the stock holds the potential for extended gains, with targets at 3025, 3865, 5160, and 5856.
Critical Support Level:
It is essential for investors to exercise caution and manage risk effectively. The analysis identifies 900 as a robust support level for RIIL, providing a reference point for risk mitigation. A breach of this support level would warrant a reassessment of the technical outlook and potential adjustments to trading strategies.
Conclusion:
Reliance Industrial Infrastructure Ltd’s chart patterns, including the cup and handle, rising channel, and RSI divergence, collectively present a compelling case for bullish momentum. Investors can capitalize on the identified breakout levels and anticipate significant upside potential. However, it is crucial to remain vigilant and adhere to risk management principles, with the 900 support level serving as a key safeguard in navigating the dynamic landscape of the stock market.
About Company
Reliance Industrial Infrastructure Ltd (RIIL) is a subsidiary of the conglomerate Reliance Industries Limited (RIL), one of India’s largest and most diversified business entities. RIIL was incorporated in 1988 and has since evolved into a key player in the infrastructure sector, contributing significantly to the nation’s industrial development.
Business Operations: RIIL is primarily engaged in the business of setting up and operating industrial infrastructure. The company’s activities include providing services in the field of transportation of petroleum products and raw water through pipelines, construction and maintenance of industrial infrastructure, and leasing of industrial and commercial premises.
Pipeline Transportation: One of the core facets of RIIL’s operations is its involvement in the transportation of petroleum products and raw water through pipelines. The company has developed an extensive pipeline network that plays a crucial role in facilitating the seamless movement of these essential commodities. This infrastructure not only enhances operational efficiency for various industries but also contributes to minimizing transportation costs and environmental impact.
Industrial Infrastructure Services: RIIL is actively involved in the construction and maintenance of industrial infrastructure. The company’s expertise in this domain contributes to the development of robust facilities that cater to the evolving needs of diverse industries. By providing comprehensive infrastructure solutions, RIIL plays a pivotal role in supporting the growth and expansion of businesses across different sectors.
Real Estate Leasing: Apart from its core infrastructure operations, RIIL is engaged in leasing industrial and commercial premises. This aspect of the business adds a layer of diversification to the company’s revenue streams. The leasing of properties is not only a strategic financial move but also aligns with the broader vision of contributing to the creation of vibrant industrial ecosystems.
Financial Performance: A key indicator of a company’s success is its financial performance. As of my last knowledge update in January 2022, RIIL has demonstrated resilience and stability in its financials. It’s important for investors and stakeholders to regularly review the company’s financial reports and performance metrics for the most up-to-date insights.
Sustainability and Innovation: In today’s business landscape, sustainability and innovation are critical aspects. RIIL’s commitment to environmental responsibility and the adoption of innovative practices contribute to its reputation as a forward-thinking organization. Embracing sustainable initiatives not only aligns with global trends but also positions the company for long-term success in an ever-changing business environment.
Challenges and Opportunities: Like any company, RIIL faces challenges inherent to its industry and the broader economic landscape. Market fluctuations, regulatory changes, and technological advancements are factors that can impact its operations. However, these challenges also present opportunities for RIIL to showcase adaptability and resilience. Keeping a watchful eye on industry trends and embracing technological advancements can position the company to capitalize on emerging opportunities.
In conclusion, Reliance Industrial Infrastructure Ltd stands as a significant player in India’s industrial landscape. Its diverse business operations, commitment to sustainability, and strategic positioning within the Reliance Industries conglomerate underscore its importance in contributing to the nation’s economic growth. As with any investment, individuals should conduct thorough research and consider the latest available information before making decisions related to RIIL.
Fundamental data study
Data Analysis:
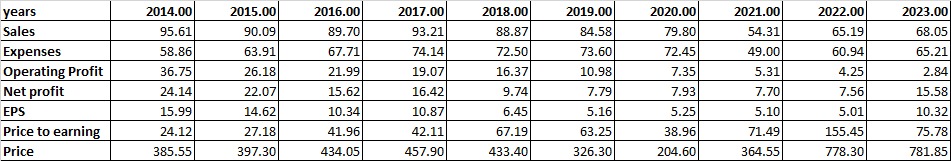
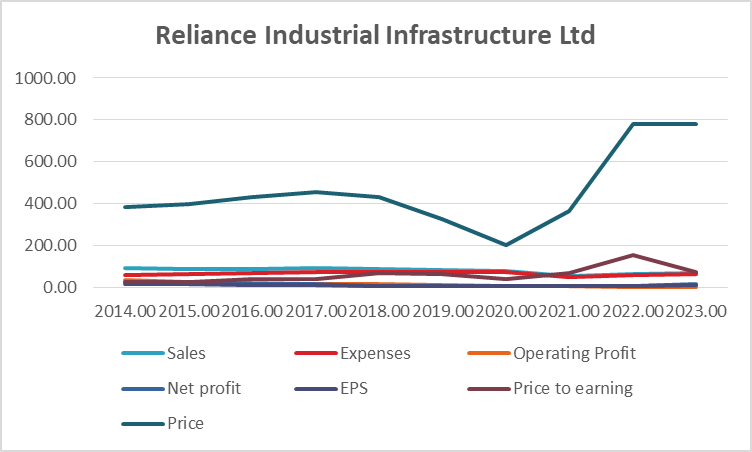
Let’s analyze the financial data provided for Reliance Industrial Infrastructure Ltd (all values are in Indian Rupees).
- Sales Trend:
- There is a consistent decrease in sales from 2014 to 2023.
- The sales dropped from 95.61 in 2014 to 68.05 in 2023, representing a decline of approximately 28.8%.
- Expenses Trend:
- Expenses also witnessed a decline, with a peak in 2017.
- The expenses reduced from 58.86 in 2014 to 65.21 in 2023.
- Operating Profit Trend:
- Operating profit shows a declining trend, indicating a decrease in profitability over the years.
- There is a considerable reduction from 36.75 in 2014 to 2.84 in 2023.
- Net Profit Trend:
- Net profit initially decreased but saw a substantial increase in 2023.
- The net profit dropped from 24.14 in 2014 to 7.56 in 2022 but then increased significantly to 15.58 in 2023.
- Earnings Per Share (EPS) Trend:
- EPS shows a similar pattern to net profit, decreasing initially and then recovering.
- The EPS dropped from 15.99 in 2014 to 5.01 in 2022 but increased to 10.32 in 2023.
- Price to Earnings (P/E) Ratio Trend:
- P/E ratio shows a fluctuating trend, reaching its peak in 2022.
- The P/E ratio increased from 24.12 in 2014 to 155.45 in 2022 and then decreased to 75.78 in 2023.
- Stock Price Trend:
- Stock price exhibits a volatile pattern, reaching its highest in 2022.
- The stock price increased from 385.55 in 2014 to 778.30 in 2022 and slightly decreased to 781.85 in 2023.
Turnaround Factors:
- The significant increase in net profit and EPS in 2023 suggests a potential turnaround.
- The decrease in expenses in 2023 may have contributed to improved profitability.
Strong Factors:
- The increase in net profit and EPS in 2023 indicates a positive shift.
- Despite challenges, the company managed to maintain a relatively high stock price.
Weak Factors:
- Declining sales and operating profit signify challenges in the core business.
- The fluctuating P/E ratio suggests market uncertainty and varying investor sentiments.
Conclusion:
While the data reflects some positive signs of a turnaround in 2023, the overall trend in sales and operating profit is a cause for concern. Investors should carefully evaluate the reasons behind the drop in sales and operating profit over the years. The fluctuating P/E ratio also indicates that the market perception of the company has been volatile.
Considering the provided data, potential investors need to weigh the positive factors such as the recent increase in net profit and EPS against the challenges presented by the declining sales and operating profit. It’s essential to closely monitor the company’s future financial reports and operational updates to assess the sustainability of the positive momentum observed in 2023.
In conclusion, while the recent improvement in financial indicators is promising, the historical trends and the volatile nature of the stock price warrant a cautious approach. Investors should conduct further research, considering additional factors, and stay updated on the company’s performance before making investment decisions based on the provided data alone.
Final outlook based on technical and fundamental study
Final Conclusion:
Reliance Industrial Infrastructure Ltd (RIIL) presents a mixed picture based on the combined analysis of financial and technical data.
Financial Analysis:
- While there are signs of a potential turnaround in 2023, with a notable increase in net profit and EPS, the overall trend of declining sales and operating profit raises concerns.
- The fluctuating P/E ratio indicates market uncertainty and varying investor sentiments.
- The recent decrease in expenses in 2023 is a positive factor contributing to improved profitability.
Technical Analysis:
- The technical analysis reveals the development of significant chart patterns, including the “cup and handle” and “rising channel,” suggesting potential bullish momentum.
- Breakouts at 1257 and 1400 levels provide entry points, with projected targets at 2400 and beyond.
- A strong support level at 900 adds a critical reference point for risk management.
Conclusion: Considering the financial and technical aspects, the recent positive indicators, especially the notable increase in net profit and EPS in 2023, present an opportunity for investors. The identified chart patterns and breakout levels suggest potential upward movement in the stock price.
Recommendation:
- Buy Level: Investors may consider initiating a buy position, particularly if the stock sustains above the breakout levels of 1257 and 1400.
- Target Level: The projected target is 2400, with potential for further gains towards 3025, 3865, 5160, and 5856 levels.
- Support Level: Maintain a strict support level at 900, acting as a crucial reference for risk management.
Fundamental Analysis: While the technical analysis provides insights into potential price movements, fundamental analysis is equally crucial. The positive signals from the financial data, including the decrease in expenses and the notable turnaround in net profit and EPS, enhance the attractiveness of the stock.
Final Verdict: Considering the potential breakout levels, projected targets, and positive fundamental indicators, RIIL appears to be a favorable buy, especially for investors seeking growth opportunities. However, it is essential for investors to monitor the company’s future financial reports and operational updates to ensure the sustainability of the positive momentum observed in 2023. As with any investment decision, thorough research, risk management, and vigilance are paramount.