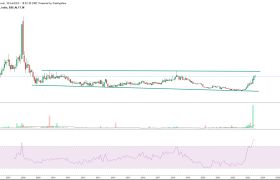
Technical chart study above is the monthly chart of given stock, and we can see that its has given breakout of expanding chart pattern we can even say that it has done “Expanding megaphone” pattern breakout at 39-40 level, and as per pattern it should go till 54-55 levels, but again it wont stop there, […]
Ahluwalia Contracts (India) Ltd | Is it worth to look this stock for long term?
Technical chart Above is the monthly chart of mention stock, and we can clearly see that is has given strong and bigger rising channel breakout on monthly chart, stock is very well moving in higher high and lower high formation, with rsi its given bullish negative divergence, as price made higher high and ris was […]
Pee Cee Cosma Sope Ltd | Long term view for small cap company
Indo Tech Transformers Ltd | Strong chart patterns | Strong Fundamentals | Good for long run?
Technical chart study Monthly chart as per monthly chart pattern we can see that stock was trading with lower highs and higher lows from past 10 years, as per chart pattern we can say that it has developed symmetrical chart pattern and even given a successful breakout at 300 level, and able to surpass past […]
Dhampur Sugar Mills Ltd | 90 Years old company | How we see its Growth further |
Technical chart study of Dhampur Sugar Mills Ltd As per our knowledge, dhamupr sugar has already given long term breakout in a year 2016 near about 80 level. but those who miss to invest that time, can still take a look at its current development.as of now we can see that, there is development of […]
Satin Creditcare Network Ltd | Technical reversal | Strong fundamentals | Can it be a future Multibagger Stock? | Check Full Report |
Satin Creditcare Network Ltd – Monthly Chart As per above chart, we can see that, after making life time high at 670.65 in year 2016, stock made “falling wedge” chart pattern till year 2020.even after breaking falling wedge pattern at 125 in 2021, stock was in small rising channel which we can see as an […]
International Combustion (India) Ltd | Strong Business | good fundamentals | technical breakout stock | possible mutibagger
Monthly Chart Impressive long term chart, stock has form rounding bottom formation and able to break its previous resistance levels, and even able to cross mid point range of visible expanding pattern.in a recent past stock able to cross its mid-zone with strong volumes and thus it can lead to test upper trendline near to […]
Nucleus Software Exports Ltd – Software company in banking sector – Scope for Growth?
Nucleus Software Exports Ltd monthly long term chart Technical study for Nucleus Software Exports Ltd As per long term or monthly chart pattern we can see that few months back stock was trading below resistance level or channel level, but recently it able to give channel breakout above 900 level and at same time it […]
Patel Engineering Ltd -Strong chart pattern with best fundamental – will it be a future mutibagger stock ??
Monthly technical chart study As per the monthly chart study, we can clearly see that stock was falling from year 2008 and in recent years iwth lower top and lower bottom formations, it able to develop falling wedge chart pattern. Highlights ProjectsThe Co has undertaken various projects such as Kameng Hydro Electric Project, SRSP Canal […]
Alfa transformers – Can it be a multibagger ? – Long term Study
Alfa Transformer – Fundamentals Market cap – 29.2cr Face value – 10 rs. Stock pe – 29 Industry pe – 31.4sales march 2023 – 29.05 cr Returns on equity – 7%return on capital emp – 10% Alfa transformers – About company Incorporated in 1982, Alfa Transformers Limited manufactures small distribution transformers and offers related technical […]


